Top Ten #ddj: The Week’s Most Popular Data Journalism Links

What are the hot data journalism tweets? Here are top links for Nov. 28-Dec 4: Data Journalism Awards (@GENinnovate); ddj survey (@ddjournalism); US infrastructure (@PostGraphics); Trump chart + cartoon (@albertocairo); Trump & Breitbart tweet analysis (@lamthuyvo); data blog (@Creatuluw) & more.

Top Ten #ddj: The Week’s Most Popular Data Journalism Links

Here are the top data journalism tweets for Mar 27- Apr 2, per our NodeXL mapping: interactive graphics (@driven_by_data); ridiculous news (@twisteddoodles); Malofiej Infographics Awards (@malofiej); Germany’s radio masts (@stimmeonline); Republicans voting with Trump (@FiveThirtyEight); & more.

Data Journalism’s Top Ten

What’s the global data journalism community tweeting about this week? Our NodeXL #ddj mapping from July 24 to 30 has @qz comparing the cost of Trump’s golf trips to transgender healthcare, @visualisingdata sharing a chart-making directory and graphics guru @EdwardTufte applying Ezra Pound’s 23 “don’ts” for writing poetry to design.

This Week’s Top 10 in Data Journalism

What’s the global data journalism community tweeting about this week? Our NodeXL #ddj mapping from January 22 to 28 finds a gorgeous data visualisation of German streets by @zeitonline, a detailed data analysis of Roger Federer’s tennis career by @srfdata and a look at eight alternatives in redistricting US voting boundaries by @FiveThirtyEight.

This Week’s Top 10 in Data Journalism

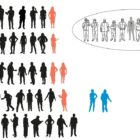
What’s the global data journalism community tweeting about this week? Our NodeXL #ddj mapping from January 29 to February 4 finds an @UpshotNYT analysis of the influence of Trump’s tweeting on Republicans’ attitudes towards the NFL, a new font typeface made out of human silhouettes created by @albertocairo and a fun Graphic Continuum card set by @jschwabish and @dataviz_catalog to use in the classroom.