How They Did It: Building a Visual Story with a Non-Visual Piece

Australian journalist Rick Feneley wrote a powerful investigative piece about a string of gay hate crimes that plagued Australia’s eastern border. But before “The Gay Hate Decades” was published, Feneley was left with one last hurdle: Creating a digital element to accompany his work. And that’s where SBS web developer Ken Macleod came in.

Eight Interactive Investigative Stories To Check Out

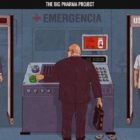
Need some inspiration on making your next immersive investigative piece pop? This seriously impressive selection from Latin America includes stories about forced sterilization in Peru, the controversial Belo Monte hydroelectric dam in the Amazon and Big Pharma’s stranglehold in the region.

How They Did It: Developing a Data-Driven Navigator on Gun Laws

Last August, Everytown for Gun Safety, a non-profit research and advocacy group for gun control, launched the Gun Law Navigator, an exploratory data visualization tool explaining how states in America regulate guns. The project, developed by the Boston-based creative digital studio Upstatement, received lots of attention not only for examining such a sensitive topic, but also for successfully telling a visual, data-driven story about a complex subject: legislation.