GIJN’s Data Journalism Top 10: 3D Animation, Brexit Borders, Bad Research, NY Subway

What’s the global data journalism community tweeting about this week? Our NodeXL #ddj mapping from September 2 to 8 finds Folha de São Paulo’s beautiful 3D animation of the Brazil National Museum’s restoration efforts, Guardian’s real-time visualization of Irish border crossings, NZZ’s look at China’s bad research impacting scientists worldwide, and The New York Times calculating the variability of New York City’s subway commute times.

Top Ten #ddj: The Week’s Most Popular Data Journalism Links

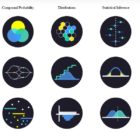
Here are the top data journalism tweets for Feb 27-Mar 5, per our NodeXL mapping: #NICAR17 readings (@albertocairo); fake news guide collaboration (@jwyg); US visa restrictions (@ddjournalism); statistics’ interactive viz (@BrownUniversity); Guardian’s 10-point guide to ddj (@smfrogers); & more.

Top Ten #ddj: This Week’s Top Data Journalism

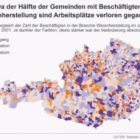
What’s the #ddj community tweeting about? Our NodeXL mapping from May 22 to 28 includes what it’s like to code as a journalist from @CJR, artists and designers visualizing Google search data from @FastCoDesign, the Data Journalism Awards 2017 shortlist from @mberzosa and Austria’s changing job market from @derStandardat.

How Not To Be Wrong

While your story can be true, it might be wrong. That’s what New York Times data journalist Robert Gebeloff explained at the recent European Investigative Journalism Conference & Dataharvest. Check out some of Gebleoff’s tips, and a data journalism checklist.

This Week’s Top Ten in Data Journalism

What’s the global data journalism community tweeting about this week? Our NodeXL #ddj mapping from October 9 to 15 has @RTSinfo looking into flight sharing platform @Wingly_UK, while @srfdata finds millions of fake @instagram followers, @jwyg charts the growth of all Internet sites, and @nytimes collaborates with @AmstatNews to promote critical thinking and data literacy.

This Week’s Top 10 in Data Journalism

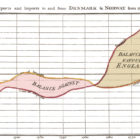
What’s the global data journalism community tweeting about this week? Our NodeXL #ddj mapping from January 8 to 14 finds free font-for-numbers by @InVisionApp, a William Playfair biography book review for @WSJBookReviews and @PublicDataLab’s just-released full version of its fake news field guide.

This Week’s Top 10 in Data Journalism

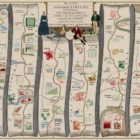
What’s the global data journalism community tweeting about this week? Our NodeXL #ddj mapping from February 19 to 25 finds economist @SethS_D analyzing Spotify data to find the correlation between our birth year and our music influences, @infowetrust illustrates three centuries of iconic infographics in a beautiful 17th century-styled dataviz and @EdjNet’s Stats Monitor gives you #ddj news leads on European data.