Data Journalism Top 10: Social Distancing Interactive, Epidemic Modeling, Germany’s Low Death Rate, and Zuckerburg TikTok Video

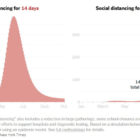
The coronavirus pandemic has resulted in the production of various interactives, charts, and simulations by data journalists and citizens around the world. This week’s NodeXL #ddj mapping from March 23 to 29 finds The New York Times explaining the dangers of ending social distancing measures by Easter, Germany’s Der Spiegel and Der Tagesspiegel measuring traffic levels and COVID-19 cases respectively, the Tampa Bay Times monitoring the situation in Florida, Kevin Simler making an interactive simulation to explain how general epidemics unfold, and Mona Chalabi creating a viral TikTok video on Mark Zuckerberg’s donation to advance coronavirus research.
Data Journalism Top 10: Social Distancing, Coronavirus Clusters, Flattening the Curve, Trump Cherry-Picks Data

The novel coronavirus is very much dominating the Twitter chatter among the global data journalism community this week. Our NodeXL #ddj mapping from March 9 to 15 finds The Washington Post simulating different social distancing scenarios and their effects on slowing the spread of COVID-19, South China Morning Post highlighting research into a cluster case, Süddeutsche Zeitung charting the exponential growth in countries with high infection rates, and The New York Times spotlighting the jobs which put workers at the greatest risk of contracting the virus.

What We’re Reading: COVID-19’s Global Press Crackdown

This week’s Friday 5, where we round up our favorite reads from around the online world in English, includes a report on the spike in crackdowns on journalists and media organizations reporting on COVID-19 , Transparency International’s suggestions for what to look out for with corruption and coronavirus, and a Citizen Lab report about how China manages social media censorship.