Top Ten #ddj: The Week’s Most Popular Data Journalism Links

Here are top data journalism tweets for Apr 17-23, per our NodeXL mapping: French voting (@lamontagne_fr); music festival gender (@pitchfork); mapping US homeless (@FastCompany); Scottish fact checking (@FerretScot); Spanish voting (@Politibot). tilegrams (@bhaskar_vk); & more.
Top Ten #ddj: This Week’s Top Data Journalism

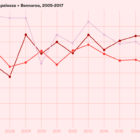
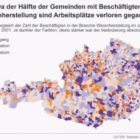
What’s the #ddj community tweeting about? Our NodeXL mapping from May 22 to 28 includes what it’s like to code as a journalist from @CJR, artists and designers visualizing Google search data from @FastCoDesign, the Data Journalism Awards 2017 shortlist from @mberzosa and Austria’s changing job market from @derStandardat.

Data Journalism’s Top Ten

What’s the global data journalism community tweeting about this week? Our NodeXL #ddj mapping from August 14 to 20 has @Forbes mapping six years of American television news, the looming Kantar @infobeautyaward’s submission deadline and @sarahslo’s list of women in the field of data visualization.

This Week’s Top Ten in Data Journalism

What’s the global data journalism community tweeting about this week? Our NodeXL #ddj mapping from October 9 to 15 has @RTSinfo looking into flight sharing platform @Wingly_UK, while @srfdata finds millions of fake @instagram followers, @jwyg charts the growth of all Internet sites, and @nytimes collaborates with @AmstatNews to promote critical thinking and data literacy.

How to Build a GIF of Satellite Imagery in R

Sometimes, the best way to tell a story is to take a bird’s eye view. Here’s how Storybench editor Aleszu Bajak did this by recreating a GIF of Chennai’s disappearing Lake Puzhal reservoir. Check out his process and code, which could be used for countless other animations — to show, say, dam collapses, deforestation, forest fires, and more.