GIJN’s Data Journalism Top 10: School Murders, Visualizing Uncertainty and Brazil’s Deadly Week

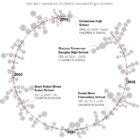
What’s the global data journalism community tweeting about this week? Our NodeXL #ddj mapping from May 28 to June 3 finds @washingtonpost’s alarming data on gun violence in American schools, @vlandham’s experiments with visualizing uncertainty and @GENinnovate with the latest data journalism trends displayed in the 2018 Data Journalism Awards entries.

GIJN’s Data Journalism Top 10: DRC’s Election Fraud, San Francisco’s Interactive Art, Ultimate Data Viz List

What’s the global data journalism community tweeting about this week? Our NodeXL #ddj mapping from January 14 to 20 finds a @FinancialTimes exposé of possible electoral fraud in Congo, @sxywu’s beautiful visualization of interaction data between a museum and the public, and @maartenzam’s the ultimate data visualization list to end all lists.

GIJN’s Data Journalism Top 10: Plastic Mountains, #SharpieGate, Stopwatch Analysis, Collaborative Software

What’s the global data journalism community tweeting about this week? Our NodeXL #ddj mapping from September 9 to 15 finds ProPublica open-sourcing its collaborative reporting software; CityLab interviewing Mark Monmonier, author of “How to Lie With Maps,” on Donald Trump’s deceptive hurricane map; Al Jazeera surveying South Sudan’s citizens on displacement; and Reuters visualizing just how bad the Earth’s problem is in terms of single-use plastics.

Investigating Uber Surge Pricing: A Data Journalism Case Study

The story published in the Washington Post’s Wonkblog ended up being about race, but it didn’t start out that way. Nick Diakopoulos, who leads the lab, wrote for the Wonkblog last year with a story on how surge pricing motivates Uber drivers to move to those surging areas, but does not increase the number of drivers on the road as Uber claims.

Getting Started in Online, Open-Source Investigations

At First Draft, we frequently receive emails from a whole range of people asking how they can start doing the sort of online open-source investigation and verification that they’ve seen us doing. The skills and methodologies used are all something that can be learnt through a little persistence, but here are a few pieces of advice to get you started.

Top Ten #ddj: The Week’s Most Popular Data Journalism Links

What’s the data-driven journalism crowd tweeting? Here are top links for Oct 24-30: Clinton/Trump facial analysis (@benheubl ); 10K edits to Clinton/Trump Wikipedia pages (@chrisalcantara); Amnesty 36-year dataviz (@jwyg); Latinos in office (@UnivisionData); open source tools (@M_Mandalka); & more.