GIJN’s Data Journalism Top 10: Luanda Leaks, A Disappeared Lake, Animated Graphics, Data Mapping, NICAR

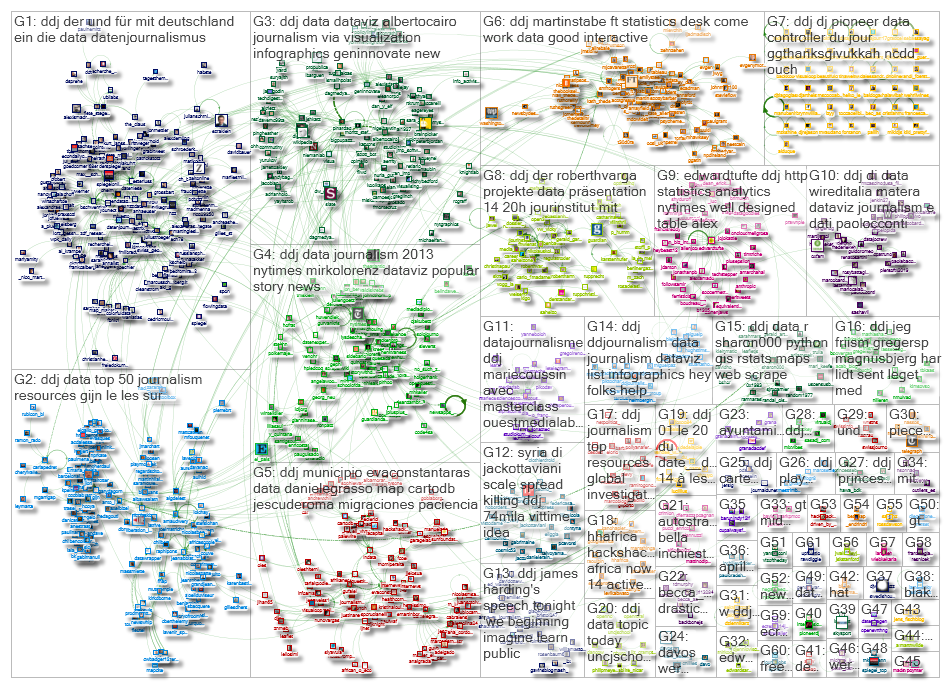
What’s the global data journalism community tweeting about this week? Our NodeXL #ddj mapping from January 13 to 19 finds the International Consortium of Investigative Journalists exposing how Africa’s richest woman really made her fortune, The Washington Post using satellite imagery to show the disappearance of an entire lake in the Philippines, El País sharing the behind-the-scenes process of their work, and Mike Reilley curating a mega list of useful data journalism tools.

GIJN’s Data Journalism Top 10: Australia’s Deadly Wildfires, Sigma Awards, Best of Data Viz 2019

What’s the global data journalism community tweeting about this week? Our NodeXL #ddj mapping from December 30, 2019 to January 5, 2020 finds The New York Times examining Australia’s brutal fire season, the launch of The Sigma Awards to honor outstanding data journalism, Der Tagesspiegel analyzing the major changes across the globe in the past decade, and inspiring best-of data visualization lists by Nathan Yau, Pew Research Center, ZEIT ONLINE, the Los Angeles Times and the Financial Times.

GIJN’s Data Journalism Top 10 for 2019: People Are The Story, Pirates vs. Princesses, Open Source Journalism, How Charts Lie, UN Votes

Throughout this year, we’ve brought you weekly “snapshots” of the Twitter conversation surrounding data journalism. But this week, we look at what the global data journalism community tweeted about the most during all of 2019. Below you’ll find links to stories from Brazil, Germany, Switzerland, the UK, the US, and elsewhere.

How They Did It: Inside a Mega-Collaboration on the US-Mexico Wall

More than 30 journalists set out to film and observe every foot of the border with Mexico, from Texas to California. The result was a fully interactive map with about 20 hours of aerial footage of the border, a seven-chapter story about the journey, 14 additional stories about the consequences of the wall, 14 mini-documentaries and an explanation of the history of the border itself. Here’s how they did it.

GIJN’s Data Journalism Top 10: Air Pollution, China Cables, #29Leaks, Predators on Dating Apps

What’s the global data journalism community tweeting about this week? Our NodeXL #ddj mapping from December 2 to 8 finds The New York Times visualizing particle pollution in augmented reality; various media outlets investigating #29Leaks, a global reporting project based on a massive data leak from an offshore services provider; Columbia Journalism Investigations and ProPublica digging into the problem of sexual predators lurking in dating apps; and The International Consortium of Investigative Journalists breaking down the significance of the China Cables.