GIJN’s Data Journalism Top 10: Mapping Wildfires, Insuring Climate Risk, Data Viz for Kids

What’s the global data journalism community tweeting about this week? Our NodeXL #ddj mapping from December 3 to 9 finds @BuzzFeedNews mapping wildfire prone areas across America, @dwnews dissecting the value of insurance against climate change, the release of @infobeautyaward winners, and @jschwabish teaching fourth grade kids the wonders of data visualization in fun and inventive ways.
Data Journalism’s Top Ten

What’s the global data journalism community tweeting about this week? Our NodeXL #ddj mapping from August 14 to 20 has @Forbes mapping six years of American television news, the looming Kantar @infobeautyaward’s submission deadline and @sarahslo’s list of women in the field of data visualization.

This Week’s Top 10 in Data Journalism

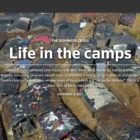
What’s the global data journalism community tweeting about this week? Our NodeXL #ddj mapping from December 4 to 10 has @Reuters documenting the deplorable living conditions at refugee camps in Bangladesh, Financial Times’ @theboysmithy transforming bad charts into useful ones and the impressive work of the 2017 @infobeautyaward winners.