GIJN’s Data Journalism Top 10: Innovative Visualization, Data Fellowships and the Dark Side

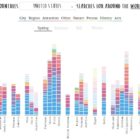
What’s the global data journalism community tweeting about this week? Our NodeXL #ddj mapping from April 23 to 29 finds @thetimes’ interactive which will determine whether you will join the dark side, @albertocairo discussing precedents to innovative visualizations and @srendgen talking about the technological revolution encouraging data journalism.

GIJN’s Data Journalism Top 10: Trump Country, Conga Lines and the Nerds in the Corner

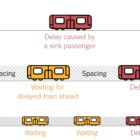
What’s the global data journalism community tweeting about this week? Our NodeXL #ddj mapping from May 7 to 13 finds @adamrpearce brilliantly illustrating the problem and causes of backed up trains along the New York subway, @Textyorgua_Eng highlights the destruction of Ukraine’s landscape due to illegal amber mining and @duc_qn analyzes which university gives you the best bang for your buck.

GIJN’s Data Journalism Top 10: School Shootings, Trains vs Planes, Ukraine-Russia Trade, UK Airport Crimes

What’s the global data journalism community tweeting about this week? Our NodeXL #ddj mapping from Aug 27 to Sept 2 finds @nytclimate personalizing climate change, @npr fact-checking the US Education Department’s school shooting data, @dwnews calculating the cost of travel to the environment, and @junkcharts dissecting the strengths of Thailand cave rescue data visualizations.

GIJN’s Data Journalism Top 10: Useful Chatbots, Less-Is-More Tables and Data Mapping Billions of Birds

What’s the global data journalism community tweeting about this week? Our NodeXL #ddj mapping from Sept 17 to 23 finds numerous data to map, from @NatGeo’s migration of billions of birds to @morgenpost’s Berlin schools and @A24COM’s internet access in Argentina. There’s also @dhanalytics’ tips on improving data tables and @mcrosasb on two useful chatbots.

The 25 Best Data Visualizations of 2018

Over the last few years, data and data analysis have taken on a new quality. Data and information is now a tool for creating beautiful visuals. What used to be simple charts and scatter plots are now complex and creative pieces of data art — some beautiful enough to hang up on your wall. Visme picked a collection of the best data visualizations of 2018.

GIJN’s Data Journalism Top 10: ICIJ’s Datashare, Visualization Talkies, Kyrgyzstan Labor

What’s the global data journalism community tweeting about this week? Our NodeXL #ddj mapping from February 4 to 10 finds exciting releases with a document analysis tool by @ICIJorg and an audio-driven visualization tool by @f_l_o_u_r_i_s_h, while @kloopnews highlights domestic labour imbalance in Kyrgyzstan and @davidottewell emphasizes that data journalism is not just for nerds in a corner.

GIJN’s Data Journalism Top 10: Data Feminism, Blockchain for Investigations, Train Speeds, EU DataViz Conference

What’s the global data journalism community tweeting about this week? Our NodeXL #ddj mapping from April 15 to 21 finds an informative interactive tool about the health of our generation by @srfdata, a piece by academic @wsaqaf explaining how journalism can utilize blockchain for investigations, data visualization teaching materials by @R_Graph_Gallery, and a book draft on data feminism by @kanarinka and @laurenfklein.

GIJN’s Data Journalism Top 10: Visualizing Climate Change, Numbers from Phrases, Democratic Donors, Moscow Money

What’s the global data journalism community tweeting about this week? Our NodeXL #ddj mapping from July 29 to August 4 finds a number of articles related to the climate crisis, including the BBC’s piece on tree planting and its interactive tool on temperatures across the world, as well as Alberto Cairo’s blog post on misleading charts created by climate deniers. We also found useful tips and tools: a data GIF maker by Google News Initiative, Datajournalism.com’s strategies for teaching data journalism, and Paul Bradshaw’s tutorial on how to extract numeric data from phrases.

GIJN’s Data Journalism Top 10: Trump’s Tweets, London’s Polluted Tube, Rising Seas, Data Voids

What’s the global data journalism community tweeting about this week? Our NodeXL #ddj mapping from November 4 to 11 finds The New York Times analyzing more than 11,000 of Trump’s tweets, The Financial Times measuring air quality in London’s Underground, Der Tagesspiegel creating an interactive of the Berlin Wall, and Nieman Lab discussing data voids exploited by media manipulators.

Top Ten #ddj: The Week’s Most Popular Data Journalism Links

Here are top data journalism tweets for Apr 24-30, per our NodeXL mapping: draw it yourself interactives (@br_data); visualizing Google searches (@albertocairo); opinion polls analysis (@SZ); Politibot’s graphics (@politibot); French election (@BIQdata); ProPublica jobs (@ProPublica); and more.