GIJN’s Data Journalism Top 10: Racing Snails, Presidential Gifts and Berlin’s Building Blocks

What’s the global data journalism community tweeting about this week? Our NodeXL #ddj mapping from May 21 to 27 finds @nigelblue’s wildly humorous infographic book about crazy competitions across the globe, @Data_Match breaks down the list of gifts given to the president of the United States by foreign leaders and @FinancialTimes looks into the pressures Antarctica faces.

GIJN’s Data Journalism Top 10: German Heat, Austrian Arms, Quebec School Fees and Salvadoran Kidney Disease

What’s the global data journalism community tweeting about this week? Our NodeXL #ddj mapping from Sept 3 to 9 finds @FiveThirtyEight attacked by the green-eyed monster with their equivalent of Bloomberg’s “Jealousy List,” @daswasfehlt breaks down Austria’s export of arms, @GoogleAI announces the beta launch of Google Datasets Search, and @SZ documents how climate change is wreaking havoc on temperatures in Germany but boosting ice-cream sales.

GIJN’s Data Journalism Top 10: New York’s Luxury Homes, Climate Dangers, Inspiring Data Viz

What’s the global data journalism community tweeting about this week? Our NodeXL #ddj mapping from Oct 8 to 14 finds 25 inspirational data visualizations collated by @VismeApp, a @nytimes op-ed by climate scientists warning of the future dangers of heat and humidity combined, @FT maps of New York’s glut of luxury residences and @ejcnet with veteran data journalists on web scraping.

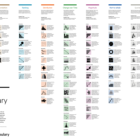
Document of the Day: Visual Vocabulary

Inspired by the Graphic Continuum by Jon Schwabish and Severino Ribeca, the Financial Times graphic team came up with their own neat chart of visualizations. The Visual Vocabulary is a guide to help journalists pick the right type of visualization for their story.

GIJN’s Data Journalism Top 10: History of Infographics, Colorism in Fashion, Weather Trends

What’s the global data journalism community tweeting about this week? Our NodeXL #ddj mapping from April 22 to 28 finds an interesting breakdown of colorism in fashion by @puddingviz, a series of gorgeous maps on natural disasters and extreme weather trends in the United States by @PostGraphics, a preview of a book on the history of infographics by @srendgen, and @UpshotNYT’s recap of its best articles from the past five years.

GIJN’s Data Journalism Top 10: Ring of Fire, Political Dynasties, Data Janitors, Hong Kong Protests

What’s the global data journalism community tweeting about this week? Our NodeXL #ddj mapping from June 10 to 16 finds a gorgeous series of data visualizations by National Geographic on the Ring of Fire, Bloomberg analyzing the influence of dynasties in the Philippines’ politics, RStudio’s Hadley Wickham talking about why you shouldn’t assign data cleaning to a “data janitor,” and BR Recherche looking at the complexity of privacy policies.

GIJN’s Data Journalism Top 10: Data Complexity, Forking Paths, Post-Brexit

What’s the global data journalism community tweeting about this week? Our NodeXL #ddj mapping from August 12 to 18 finds information designer Giorgia Lupi discussing how to embrace data complexity, The New York Times Opinion building a forking path visualization to predict an individual’s political leanings, the Guardian visualizing Brexit’s potential impact on the UK’s food imports, and El Universal Mexico looking at the incidences of crime claiming young victims.

Top Ten #ddj: The Week’s Most Popular Data Journalism Links

What’s the data-driven journalism crowd tweeting? Here are the top links drawn from tweets during October 10-15: infographic sketches, the growth of data journalism, the Tapestry Conference, using Googlescraper, conflicts over water, and an Olympics dataviz.

Top Ten #ddj: The Week’s Most Popular Data Journalism Links

Here are the hottest data journalism tweets for Jan 23-29, per our NodeXL mapping: 100 Years of infographics (@NatGeoMag); Trump’s wall size (@thetruesize); Women’s March (@womensmarch); journocoding (@journocode); dataset viz 25 ways (@flowingdata); dataviz stocktake (@eagereyes); & more.