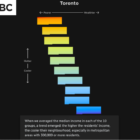
CBC heat islands graphed by economic diversity

Data Journalism Top 10: Sweltering Cities, Digital Inequity, Climate & Sleep, COVID & Schools

As parts of the world endure record-breaking temperatures, a highlight from the world of data journalism this week involves an analysis of how “heat islands” in Canadian cities vary based on economic strata. Our weekly Top Ten in Data Journalism also looks at the global spread of Pegasus spyware, digital inequity in the US, and how the COVID-19 pandemic affects school children in Latin America.

My Favorite Tools: Indian Journalist and Data Designer Gurman Bhatia

For GIJN’s My Favourite Tools series, we spoke with Indian journalist and information designer Gurman Bhatia. She has worked at the Hindustan Times in Delhi and been a part of the award-winning team at Reuters Graphics, where she worked on visualizations for topics as diverse as election fraud in India, use of force during protests in Hong Kong, and bushfires in Australia.

Tips for Reporting on Human Trafficking and Forced Labor

Slavery is not a vestige of the past, and according to UN data there are an estimated 40 million victims of modern slavery today. An all-star team of journalists, editors, and consultants who have investigated and exposed extraordinary cases of modern slavery and forced labor shared their stories and tips for reporters at GIJC21.