Veteran Mexican journalist Alejandra Xanic shares the lessons she learned in setting up an investigative nonprofit, from how to move beyond prioritizing survival to the importance of administrative support.
In this year’s GIJN’s Editor’s Pick series, Africa editor Benon Herbert Oluka compiled a list of some of the top investigative stories produced and published or broadcast by media organizations based in sub-Saharan Africa in 2020.
As part of our annual Editor’s Pick series, read on to discover the best investigations in French published this year and selected by GIJN French Editor Marthe Rubio and GIJN Francophone Africa Editor Maxime Domegni.
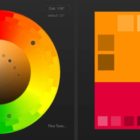
“Death is the great equalizer,” or so the saying goes. But our NodeXL #ddj mapping from September 21 to 27 finds an investigation by The Boston Globe Spotlight team that proves otherwise: race and income influences how and when people die. In this Top 10 #ddj edition, we also found The Markup launching its new privacy tool, the Financial Times examining how Finland, and the cities of Madrid and New York City handled the pandemic, as well as a great guide by Datawrapper’s Lisa Charlotte Rost to choosing better colors for your charts.
For this week’s Friday 5, where GIJN rounds up key reads from around the world, we found The Markup creating an online privacy tool, suggestions on how to make your maps more neutral, and practical tips for pitching donors during a pandemic.
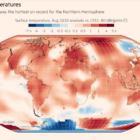
How fast is the coronavirus spreading in countries around the world? Our NodeXL #ddj mapping from September 14 to 20 finds data visualization designer Jan Willem Tulp simulating the speed of COVID-19 infections and German television news program ZDF heute mapping how the pandemic traversed the globe. Meanwhile, Thibi Recipes explores tutoring data journalism as if you’re following a cooking recipe, the Financial Times reports on climate extremes, and ICIJ and Buzzfeed bare suspect financial data.