News & Analysis

Saving Journalism: A Vision for the Post-COVID World
|
A new report maps ambitious COVID-era efforts around the world to save journalism, including ideas from the United States, South Africa, Denmark, and Singapore.
Global Investigative Journalism Network (https://archive.gijn.org/tag/facebook/page/3/)
A new report maps ambitious COVID-era efforts around the world to save journalism, including ideas from the United States, South Africa, Denmark, and Singapore.

Cómo los periodistas pueden usar ciertas herramientas para promocionar efectivamente su contenido y llegar a audiencias más amplias.

С помощью разных хитрых операторов в Google, обратного поиска по изображениям и визуального мышления можно добиться прогресса в ваших расследованиях. Советы Хенка ван Эсса.

As governments around the world continue vaccination efforts and extend lockdowns, some experts argue that more data is needed to evaluate the effectiveness of immunization campaigns and mobility restrictions. Our NodeXL #ddj mapping from January 11 to 18 found outlets in Germany and the United Kingdom analyzing government measures to reduce the impact of the COVID-19 pandemic. In this edition, we also feature an insightful interview with former Washington Post journalist Aaron Williams, an interactive timeline of the US Capitol riot by ProPublica, and a refreshing data visualization project by The Pudding.

Приёмы для непрямого поиска неуловимой информации в социальных сетях от Хенка ван Эсса, в том числе, и через специальные созданные им самим поисковые приложения.

In a GIJN masterclass webinar presented to 700 journalists from 94 countries, BBC internet research expert Paul Myers described the open source tools, syntax tricks, and search techniques that can help unearth elusive content, images, and social media posts. Myers cited searches for information on COVID-19 in numerous examples, and stressed the need for logical thought in order to unlock the power of advanced search tools.
В этом выпуске –содержательное интервью с бывшим журналистом Washington Post Аароном Уильямсом, интерактивная хронология беспорядков на Капитолии США от ProPublica и новый проект по визуализации данных из ситкомов от Pudding.
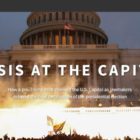
Scenes of supporters of outgoing President Donald Trump storming the US Capitol building dominated news headlines and filled social media feeds last week. Our NodeXL #ddj mapping from January 4 to 10 found Reuters producing a play-by-play summary of what happened, and FiveThirtyEight examining the stark difference in reaction by the authorities to the Capitol mob compared to Black Lives Matter protesters. Also in this edition, we feature National Geographic’s cartography archive, Data Crítica’s investigation into under-counting of Indigenous COVID-19 infections, and The Markup’s analysis of the impact of Facebook’s political ads.
В этом выпуске: Reuters с пошаговым описанием бунта на Капитолии, архив карт National Geographic за 130 лет, BBC со сравнением различных вакцин и особенностей их распространения, Markup с анализом влияния политической рекламы в Facebook и Washington Post с обсуждением этичности покупки данные на черном рынке.
Español |العربية
“Syndicating” content is one way for investigative journalism organizations to widen their readership, increase their visibility, and earn revenue. Arranging such republishing is more feasible and beneficial for established organizations, especially when it comes to online distribution by the tech behemoths.