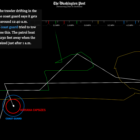
This week’s Top 10 in Data Journalism looks into a deadly migrant tragedy in the Mediterranean, nepotism in US politics, French police brutality, and record-breaking global warming.
This GIJN resource page aims to encourage more investigative reporting about the climate crisis. In Part 1, we begin with articles that provide concrete suggestions for investigative projects.
The South African investigative site Oxpeckers uses a combination of data analysis, collaboration, and interactive data visualization tools to tell the most compelling stories about the land and those accused of damaging it. From mining to environmental crimes and wildlife trafficking, it has brought investigative techniques to beats like mining that were once the preserve of business reporters.
What’s the global data journalism community tweeting about this week? Our NodeXL #ddj mapping from February 12 to 18 finds @MattLWilliams discussing the ethics of publishing Twitter content, @MaryJoWebster explaining several common “dirty data” problems and @MediaShiftOrg showing examples of the powerful impact of small data teams in newsrooms.
What’s the global data journalism community tweeting about this week? Our NodeXL #ddj mapping from February 19 to 25 finds economist @SethS_D analyzing Spotify data to find the correlation between our birth year and our music influences, @infowetrust illustrates three centuries of iconic infographics in a beautiful 17th century-styled dataviz and @EdjNet’s Stats Monitor gives you #ddj news leads on European data.