Forbidden Stories' Pegasus Project exposé

Data Journalism Top 10: Pegasus, Silencing Reporters, Europe Flooding, Diversity Mapping, K-pop

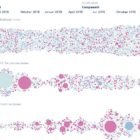
Our NodeXL mapping from July 12 to 18, which tracks the most popular data journalism stories on Twitter each week, found a series of articles resulting from the collaborative project that analyzed an unprecedented leak of more than 50,000 phone numbers selected for surveillance. In this edition, we also feature an insight into Facebook’s data wars by The New York Times, an interactive piece by Al Jazeera on how the holy city of Mecca has expanded, and a colorful project by the Washington Post on the rise of K-pop.

Data Journalism Top 10: Refugee Trails, Sri Lanka’s Eco-Disaster, Pandemic Poachers, German Voters, Sigma Awards

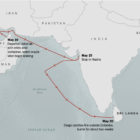
A sunken ship with a toxic cargo threatens to cause one of the worst environmental disasters in the history of Sri Lanka. Our NodeXL mapping from June 14 to 20 found a story by The Washington Post examining what caused the incident and evaluating the potential damage to marine wildlife. In this edition we also feature a piece by Al Jazeera evaluating 70 years of journeys made by refugees, an investigation into recyclable waste by Brazilian news outlet Metrópoles, and take a look at the winners of the 2021 Sigma Awards recognizing the best data journalism around the globe.

Data Journalism Top 10: Scented Candles, COVID Risk Simulator, Trump’s Final Regs, Sigma Awards

Are scented candles a casualty of the coronavirus crisis? Our NodeXL #ddj mapping from November 23 to 29 found researcher Kate Petrova’s data analysis revealing that scented candles have suffered a blow in online reviews and a decrease in ratings, possibly linked to the coronavirus’ ability to affect people’s sense of smell. Elsewhere, Germany’s Zeit Online created a COVID-19 infection risk calculator, the COVID Tracking Project explained how holidays and weekends disrupt the recording and publishing of virus data, and Reuters analyzed the shortcomings of the coronavirus contact tracing system in England. Meanwhile, the Sigma Awards, which celebrate the world’s best data journalism, have opened for entries.

Data Journalism Top 10: Musical Taste by Politics, Podcasts, Polling Problems, COVID Tweet Analysis

The US presidential election dominated the Twitter chat waves last week. Our NodeXL #ddj mapping from November 2 to 8 found data journalists sharing live election results trackers by Bloomberg, The Washington Post, and The New York Times, while The Atlantic and Slate weighed in on the problems of polling. Elsewhere open source platform Mapbox is organizing an election mapping contest, and Lazer Lab created a dashboard to explore 29 million tweets related to COVID-19 shared by over half a million Americans.

Data Journalism Top 10: Animating COVID Masks, Mapping US Campaign Cash, Homeless Arrests, Berlin Protests

Research shows that masks are an essential defense against the coronavirus. Our NodeXL #ddj mapping from October 26 to November 1 finds The New York Times using animation and augmented reality to show just how masks work to filter and trap air particles that may carry the virus. This edition also includes several pieces on the United States presidential election: FiveThirtyEight founder Nate Silver talks to Vox about polling errors and uncertainties, freelance journalist Betsy Mason explains common shortcomings of US election maps, and NYT analyzed more than 25 million donations to Trump and Biden’s presidential campaigns.

Data Journalism Top 10: A Stunning COVID Data Blunder, Beautiful News, Arctic Fires, Eviction Abuses, Isolating Students

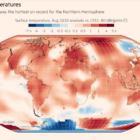
The advancement of technology and availability of complex data tools has been a real boon to society, but utilizing the wrong tools for the job can have dire consequences. Our NodeXL #ddj mapping from October 5 to 11 finds British media organizations the BBC and the Guardian reporting on a blunder by the English national health authority: it used the wrong Excel file format to store data, resulting in the loss of thousands of COVID-19 test data results. Meanwhile, German television news program ZDF heute highlighted how the Arctic has reached record high temperatures this year, DCist and Spotlight DC examined problems in the process of evictions, and we find Information is Beautiful offering a daily feed of uplifting news among the gloom of 2020’s news cycle.

Data Journalism Top 10: Mapping the Pandemic, Shrinking Japan, Data Recipes, Extreme Temps, Google Election Searches, FinCEN Files

How fast is the coronavirus spreading in countries around the world? Our NodeXL #ddj mapping from September 14 to 20 finds data visualization designer Jan Willem Tulp simulating the speed of COVID-19 infections and German television news program ZDF heute mapping how the pandemic traversed the globe. Meanwhile, Thibi Recipes explores tutoring data journalism as if you’re following a cooking recipe, the Financial Times reports on climate extremes, and ICIJ and Buzzfeed bare suspect financial data.

Data Journalism Top 10: North Korea Ghost Ships, Trolls Attack WHO, Al Pacino’s Wardrobe, COVID Air Travel

Satellite imagery has become increasingly useful in establishing evidence of human rights abuses and in shining a light on dubious activities being conducted in secretive parts of the world. Our NodeXL #ddj mapping from August 17 to 23 finds NBC News utilizing satellite data to solve a long-standing mystery about North Korean “ghost boats” washing up on Japanese shores, The New York Times analyzing footfall data to determine how the coronavirus pandemic has influenced consumer spending, and Bellingcat revealing a coordinated network of attacks on Twitter against the director general of the World Health Organization (WHO).