Top Ten #ddj: The Week’s Most Popular Data Journalism Links

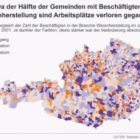
Here are top data journalism tweets for May 1-7, per our NodeXL mapping: delayed cherry blossoms (@TheEconomist); dataviz how-to (@albertocairo); 20 million starving (@washingtonpost); Munich route planner code (@Munichrocker); FB German filter bubble (@SZ); Open Data Index (@pinardag); and more.

Top Ten #ddj: This Week’s Top Data Journalism

What’s the global #ddj community tweeting about? Our NodeXL mapping from June 5 to 11 includes #VisualTrumpery from @mcrosasb, analysis of Theresa May’s election disaster by @GuardianVisuals, dataviz structuring strategies from @eagereyes, and school enrollment woes in Delhi from @htTweets.

Top Ten #ddj: This Week’s Top Data Journalism

What’s the #ddj community tweeting about? Our NodeXL mapping from May 22 to 28 includes what it’s like to code as a journalist from @CJR, artists and designers visualizing Google search data from @FastCoDesign, the Data Journalism Awards 2017 shortlist from @mberzosa and Austria’s changing job market from @derStandardat.

Top Ten #ddj: This Week’s Top Data Journalism

What’s the global #ddj community tweeting about? Our NodeXL mapping from June 19 to 25 includes Germany’s housing discrimination problem by @SPIEGELONLINE and @br_data, data on police interaction with the public from @StanfordEng and @StanfordJourn and a report on big data for gender from @Data2X.

Data Journalism’s Top Ten

What’s the global data journalism community tweeting about this week? Our NodeXL #ddj mapping from August 21 to 27 has useful digital forensics tools from @bellingcat, mathematician Cathy O’Neil warning us about blind faith in big data and an analysis of Delhi’s insane dowry demands by @htTweets.

Data Journalism’s Top Ten

What’s the global data journalism community tweeting about this week? Our NodeXL #ddj mapping from Sept 11 to 17 has @puntofisso using machine learning to map the average face of British politicians, @AftertheFloodco creating a font that turns numbers into sparklines, and @datassist listing seven deadly sins in statistical analysis.

Data Journalism’s Top Ten

What’s the global data journalism community tweeting about this week? Our NodeXL #ddj mapping from August 28 to Sept 3 has the most amusing memes you’ll read all day from  @xocasgv, a trip with @stuartathompson to the New York Times’ morgue to discover fascinating graphics from the 50s and 60s and crowdsourcing flooded roads by @HoustonChron.

Data Journalism’s Top Ten

What’s the global data journalism community tweeting about this week? Our NodeXL #ddj mapping from August 14 to 20 has @Forbes mapping six years of American television news, the looming Kantar @infobeautyaward’s submission deadline and @sarahslo’s list of women in the field of data visualization.

This Week’s Top Ten in Data Journalism

What’s the global data journalism community tweeting about this week? Our NodeXL #ddj mapping from September 25 to October 1 has @FT mapping the route in a day of a London Uber driver, #NICAR18 registration opening up, @Lattif charting Africa’s internet shutdowns using @atlascharts and loads of German election data visualizations.

This Week’s Top Ten in Data Journalism

What’s the global data journalism community tweeting about this week? Our NodeXL #ddj mapping from Sept. 18 to 24 features Wikipedia of Data Visualization, the State of Data Journalism, Dear Data Postcard Kit, and German election data.