Data Journalism
This Week’s Top 10 in Data Journalism
|
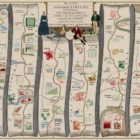
What’s the global data journalism community tweeting about this week? Our NodeXL #ddj mapping from February 19 to 25 finds economist @SethS_D analyzing Spotify data to find the correlation between our birth year and our music influences, @infowetrust illustrates three centuries of iconic infographics in a beautiful 17th century-styled dataviz and @EdjNet’s Stats Monitor gives you #ddj news leads on European data.