This guide is created to encourage Indigenous investigative journalists and to provide empowering tips and tools. Developed collaboratively by the Global Investigative Journalism Network (GIJN) and the Native American Journalists Association (NAJA), the guide explores eight key topics.
Our weekly NodeXL and human curation of the most popular data journalism stories on Twitter features The Financial Times’ 10 charts visualizing developments in the United Kingdom during Elizabeth’s reign, The Marshall Project’s look at how government Covid-19 relief funds were used, and Taiwan Data Stories’ scrollytelling project about Taiwan’s iconic street food.
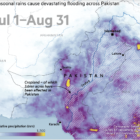
This week’s Top 10 in Data Journalism features the carbon footprint of celebrity jets, the unsanctioned destruction of the Amazon, secret documents seized from Trump, massive Pakistan flooding, and a look into the history of memes.
There is no way for investigative journalists to completely eliminate the risk of being tracked through metadata, but in an interview with Reporters Without Borders, technology expert Benjamin Finn offers a series of tips on how to protect both your sources and yourself.
Whether investigating human rights abuses, money laundering, or even public officials’ conflicts of interests, reporters are increasingly developing their own databases for investigative projects. Here are a series of tips drawn from the experiences of a number of international journalists and from the author’s personal experience gathering and creating data sets for investigative stories.
Without a primary visual medium, radio reporting has trailed other media formats in data journalism. But creative data solutions for radio are emerging — and experts shared a dozen tips to help radio reporters broaden their storytelling repertoires, populate digital versions of their stories with data, and empower listeners to visualize without visuals.
Data journalism can show trends, maps, and patterns, highlighting whether violence has gone up or down in a region, where conflict is located, and how this relates to conditions on the ground that impacts civilians, such as migration or refugees. Here’s more on how you can use it in your next investigation.
No law enforcement agency announced any criminal investigation into the attempted murder of Russia’s leading opposition figure, Alexey Navalny, after he was poisoned with a chemical weapon in Russia last year. Instead, investigative journalists stepped forward. In a GIJN webinar, journalists from Bellingcat and Russia’s The Insider explained how, and why, they used black market data to help expose the true culprits behind that attack.
At the recent NICAR21 data journalism conference, organized by Investigative Reporters and Editors, experts shared dozens of new tools and plugins that can save time or add efficiency and insight to any investigation.
Data journalists often encounter the term “standard deviation” when reading research, from climate change studies to social science papers. This tipsheet explains how researchers use this measure, and how reporters can benefit from the context it provides.