The death of African American George Floyd in police custody has resulted in a major uproar against structural racism in the United States. Our NodeXL #ddj mapping from June 1 to 7 finds The New York Times examining police use of force in Minneapolis, the city in which Floyd died after being pinned down by a police officer. The Washington Post also dug into data of every fatal shooting in the US by police officers since 2015.
The COVID-19 pandemic has reshaped the way journalists work, not least because many authorities have cited the contagion as a reason to crack down on the news media. Certain dangers will subside with time but some of the measures put into place that restrict press freedom – whether intended or not — could continue well into the future.
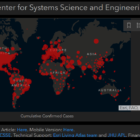
GIJN has created a multi-part guide on where to obtain data about the spread of COVID-19 and its consequences. The document links to official and unofficial international sources on health and economic data, links to information on government policy responses, and more than a dozen sites working on pandemic projection modelling.
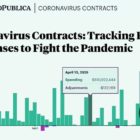
Which communities are most economically affected by the coronavirus pandemic? Our NodeXL #ddj mapping from May 25 to 31 finds the Toronto Star looking at the effects of Canada’s lockdown on different communities in the country, ProPublica sharing a tool that lets you explore United States federal government contracts related to the coronavirus, the Financial Times analyzing excess mortality in 19 countries, and the Knight Center for the Journalism in the Americas offering a free online course on ethics in data journalism.
Пандемия подчеркнула неравенство в обществе, нарушения и кумовство в заключении госконтрактов и эффективность жестких карантинных мер. Как дата-журналисты задокументировали и визуализировали эти явления, читайте в нашем рейтинге.
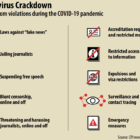
How to investigate government spending related to the COVID-19 pandemic is the subject of a new resource from GIJN. Our guide describes how to understand and probe the procurement process and identifies the red flags that may signal fraud and corruption.
What should journalists investigate about government spending to fight the coronavirus pandemic? What should they look for and where can they find information? That’s the topic of a new GIJN resource, full of links and examples.
Journalists around the world are investigating many angles of the coronavirus pandemic. GIJN has collected some of the best reporting to date, hoping these 50 examples from 17 countries will inspire even more investigative journalism.
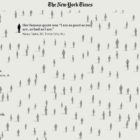
Разрушительные последствия пандемии COVID-19 могут легко потеряться в лавине публикаций и цифр. Чтобы отразить истинные масштабы трагедии, The New York Times попытались очеловечить данные. Также в десятке: цвета и оттенки в визуализациях, данные в деловой журналистике и ругательства в бразильском кабмине.
The devastating consequences of the coronavirus pandemic can get lost in the mass of numbers presented. Journalists are working hard to humanize the data. Our NodeXL #ddj mapping from May 18 to 24 finds The New York Times with a moving tribute to lives lost to COVID-19; Schema Design, the Google News Initiative, and Axios visualizing coronavirus-related Google searches; and The Atlantic revealing the US CDC conflated results of two types of coronavirus tests.