How Leading Photojournalists Around the World Are Documenting COVID-19

In interviews with GIJN, six leading photojournalists from around the world described six very different approaches for dealing with the safety, access, and technical challenges of shooting the pandemic. From using bulletproof vests and embedding strategies to projected images and screenshots of Zoom meetings, these photographers detailed some of the creative thinking needed to document a world in lockdown.

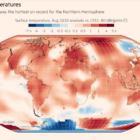
Data Journalism Top 10: Mapping the Pandemic, Shrinking Japan, Data Recipes, Extreme Temps, Google Election Searches, FinCEN Files

How fast is the coronavirus spreading in countries around the world? Our NodeXL #ddj mapping from September 14 to 20 finds data visualization designer Jan Willem Tulp simulating the speed of COVID-19 infections and German television news program ZDF heute mapping how the pandemic traversed the globe. Meanwhile, Thibi Recipes explores tutoring data journalism as if you’re following a cooking recipe, the Financial Times reports on climate extremes, and ICIJ and Buzzfeed bare suspect financial data.

GIJN’s Data Journalism Top 10: Innovative Visualization, Data Fellowships and the Dark Side

What’s the global data journalism community tweeting about this week? Our NodeXL #ddj mapping from April 23 to 29 finds @thetimes’ interactive which will determine whether you will join the dark side, @albertocairo discussing precedents to innovative visualizations and @srendgen talking about the technological revolution encouraging data journalism.