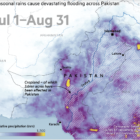
This week’s Top 10 in Data Journalism features the carbon footprint of celebrity jets, the unsanctioned destruction of the Amazon, secret documents seized from Trump, massive Pakistan flooding, and a look into the history of memes.
Our weekly analysis of the most popular data journalism stories on Twitter features the mapping of Europe’s drought-stricken rivers, NASA’s plans to return to the moon, how the war in Ukraine compares to other modern conflicts, tracking a stolen truck, and examining Chinese censorship of foreign content with edited episodes of The Big Bang Theory.
Our weekly analysis of the most popular data journalism stories on Twitter spotlights a Bloomberg investigation on Google search results for abortion, a story on the impact of state meddling in the finances of Canada’s Indigenous First Nations, data revealing a crisis in accident and emergency services in England, heat wave predictions for the year 2053 in the US, and for the film fans, a network visualization of the Marvel Cinematic Universe.
This edition of the GIJN Toolbox explores global databases and remote sensing resources that reporters can use to investigate local environmental threats.
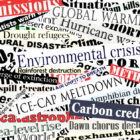
On the second day of GIJC21, journalists from Brazil, Indonesia, and The Netherlands offer tips and tools on how to cover what may be the most important story we ever dig into: how humanity copes with the unprecedented challenge of climate change.
Satellite imagery provides information that can enhance the ability to write compelling narratives about the state of our planet, cutting across multiple beats. But such a tool tends to be complex and out of the reach for many journalists, so this guide offers a process that reporters interested in covering the climate crisis can use for story projects.
This week’s Data Journalism Top 10 features a dive into the murky market for vehicle data, an analysis of the deteriorating quality of education in poorer countries, a piece on how higher temperatures affect our lives, and fact-checking India’s encounter killings.
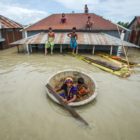
Writing about sea level rise doesn’t necessarily require using historic data or scientific projections, although such information is available for coastal locations worldwide. The practical effects are already visible and affecting people’s lives.
As parts of the world endure record-breaking temperatures, a highlight from the world of data journalism this week involves an analysis of how “heat islands” in Canadian cities vary based on economic strata. Our weekly Top Ten in Data Journalism also looks at the global spread of Pegasus spyware, digital inequity in the US, and how the COVID-19 pandemic affects school children in Latin America.
For journalists, explaining the causes and consequences of rising sea levels is a critical and challenging assignment. To address this aspect of the climate crisis, GIJN is publishing an extensive guide to support journalists covering the impact of rising seas around the world.