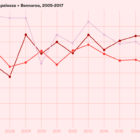
Here are top data journalism tweets for Apr 17-23, per our NodeXL mapping: French voting (@lamontagne_fr); music festival gender (@pitchfork); mapping US homeless (@FastCompany); Scottish fact checking (@FerretScot); Spanish voting (@Politibot). tilegrams (@bhaskar_vk); & more.
Here are top data journalism tweets for May 1-7, per our NodeXL mapping: delayed cherry blossoms (@TheEconomist); dataviz how-to (@albertocairo); 20 million starving (@washingtonpost); Munich route planner code (@Munichrocker); FB German filter bubble (@SZ); Open Data Index (@pinardag); and more.
Data visualization specialist Andy Kirk took a look at the most significant developments in the field so far this year and found the rise of the datagif, impressive work at the Hindustan Times and some beauties over at Periscopic. Here’s his top ten list in data visualization from January to June 2017.
Following a surge of tick-borne illnesses in the northeastern US, two reporters with the Center for Public Integrity are investigating the health impacts resulting from climate change — and they are engaging the help of health professionals and the public to gather stories and data.
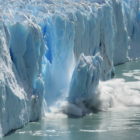
From the tropics to the Arctic, Indigenous peoples are on the front lines of the climate crisis. Investigative reporting is critical to tell their stories, delve into the causes and effects of global warming, and examine mitigation strategies.
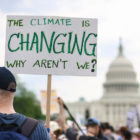
Climate change is such a big and important topic that there are many opportunities for journalists to investigate it, writes James Fahn, and so far they may just be scratching the surface.
What’s the investigative journalism twist on covering the climate crisis? Much of the biggest news understandably comes from scientists, but there’s lots of potential for imaginative reporting, as discussed in a new GIJN resource guide on climate.
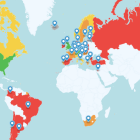
Time for a new collection of tools and reports. This week we’ve got a human rights database, file conversion for 208 formats, and nine new reports from research organizations, ranging from terrorism and corruption to European migration. Got a suggestion for The Research Desk? Write me at gprice@mediasourceinc.com.