Data Journalism Top 10: Russia’s School Roads, Myanmar’s Rich Generals, Cameroon’s Deadly Gold Mines, Visualizing the Capitol Riot

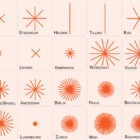
In the wake of the terrorist attacks on September 11, 2001, the United States invaded Afghanistan to overthrow the Taliban. As the US prepares to withdraw its troops later this year, our NodeXL #ddj mapping found an interactive project by Al Jazeera showcasing the impact of a conflict that has directly claimed the lives of an estimated 241,000 people. In this edition, we also feature a story about the difficulties some Russian students have getting to school by IStories, an investigation into deaths related to gold mining holes by InfoCongo, and a visual vocabulary for data projects by the Financial Times.

Data Journalism Top 10: Apartheid Architecture, Night Trains, Conflict Reporting, LGBTQ & Refugee Vaccines

Would you board a night train instead of a plane in order to help protect the environment? European policymakers hope more and more citizens will do so. Our NodeXL #ddj mapping from May 3 to 9, found an article by Bloomberg analyzing a plan to drastically cut greenhouse gas emissions by rolling out more cross-border rail lines. In this edition, we also feature a multimedia project looking at an architectural phenomenon linked to apartheid in South Africa, a Washington Post story about the true toll of the coronavirus pandemic in Mexico City, and a guide on using data in conflict reporting.

Data Journalism Top 10: The Rise of Big Tech, India’s Bad Vaccine Data, Why Data Journalists Need Safeguards

Four of the world’s most influential technology companies are based on the US West Coast. Amazon, Apple, Facebook, and Google have had an enormous impact on our daily lives. But how did Big Tech get so big? Our NodeXL #ddj mapping from April 19 to April 25 found a piece by The Washington Post showing how the success of these behemoths has been fueled by hundreds of acquisitions of smaller companies over the past decade. In this edition, we also feature an investigation into faulty vaccine data publicized by the Indian government, a list of the world’s top 1,000 climate scientists by Reuters, and a look at Europe’s growing rail network.

Data Journalism Top 10: Ramadan Fasting, Volcanic Eruptions, Climate Change Economics, China’s Forced Labor

Driving an electric car and buying solar panels are things individuals can do to help slow climate change. But according to a new study, most people don’t realize that achieving a real impact on greenhouse emissions requires significant lifestyle sacrifices. Our NodeXL #ddj mapping from April 12 to April 18 found a story by the Financial Times showing that the best way in individual can reduce their carbon footprint is to have one less child. We also feature an explainer of Ramadan fasting by Al Jazeera, a look into China’s polysilicon factories by Bloomberg, and Chinese tycoon Jack Ma’s jet-setting ways.

Data Journalism Top 10: Mission to Mars, Myanmar’s Protesters, Sand Mining, Journalism in Russia

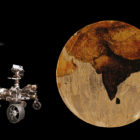
After going through “seven minutes of terror,” NASA’s Perseverance rover managed to successfully touch down on Mars last week. Our NodeXL #ddj mapping from February 15 to 21 found reporting by The Wall Street Journal and Al Jazeera, which offers more insight into the rover’s journey to the red planet. In this edition, we also feature a story about the boom in independent journalism in Russia, an analysis of the future of South Africa’s coal mining industry, and a critique of data visualization’s ability to fully convey the realities of large-scale tragedies.

Data Journalism Top 10: Polarized America, Australia’s Pandemic, Poland’s Toxic Air, the Arab Spring, Life as Lego

Our NodeXL #ddj mapping from January 25 to 31 found interactive projects by the Australian Broadcasting Corporation and The Guardian analyzing these events. In this edition, we also feature environmental reporting by The New York Times and The Economist, a Wall Street Journal story on the GameStop Reddit mania that shook stock markets, and a visual representation of 2020 using Lego bricks.

Data Journalism Top 10: Ranking Halloween Candy, Formula 1, Canadian Prisons, COVID-19 Indoors

Gearing up for Halloween? You’ll want to refer to our NodeXL #ddj mapping from October 19 to 25. We found FiveThirtyEight’s ultimate Halloween candy ranking from the archives to please the palates of finicky trick-or-treaters. This edition also includes The Economist’s mathematical model to determine whether Formula 1 racing success depends on its driver or the car engineer; The Globe and Mail examines bias in Canada’s prison system; and El Pais looks into how to reduce the probability of COVID-19 transmissions indoors.