GIJN’s Data Journalism Top 10: Stories with Maps, Tools with Charts, Casting for Shakespeare

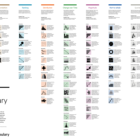
What’s the global data journalism community tweeting about this week? Our NodeXL #ddj mapping from October 15 to 21 finds @Esri’s @AllenCarroll talking the power of maps in storytelling, @visualizingdata’s catalogue of charts and corresponding tools to help information designers, and @ericwilliamlin’s deep dive into the data of casting decisions in Shakespearean plays since the 1900s.

GIJN’s Data Journalism Top 10: Dear Abby Data, South Africa’s Pit Toilets, The Economist’s Inequality, Politico Goes Open Source

What’s the global data journalism community tweeting about this week? Our NodeXL #ddj mapping from November 19 to 25 finds society’s most urgent concerns in the textual data of a long-standing @dearabby column, a kerfuffle over @The Economist’s regional inequality graph, dangerous pit toilets in Africa highlighted by @SECTION27news and a gift of sorts from @politico, who open sourced their elections data management system.

GIJN’s Data Journalism Top 10 in 2018: Visual Vocabulary, Eclectic Visualization, Google Dataset Search, Laughing in Parliament

It’s been a great year for data journalism and visualizations. GIJN’s Top 10 #ddj series captured snapshots of what’s popular on Twitter among the global data journalism community for 46 weeks in 2018. For this edition, we asked NodeXL to map 2018’s most popular #ddj tweets from January 1 to December 11 and the results are in. This year’s most popular tweets include @FinancialTimes’ ever-popular Visual Vocabulary chart, @Google’s Dataset Search, @hnrklndbrg’s eclectic visualizations, and @SZ’s analysis of Germany’s parliamentarians using laughter as a debate weapon.

The 25 Best Data Visualizations of 2018

Over the last few years, data and data analysis have taken on a new quality. Data and information is now a tool for creating beautiful visuals. What used to be simple charts and scatter plots are now complex and creative pieces of data art — some beautiful enough to hang up on your wall. Visme picked a collection of the best data visualizations of 2018.

Document of the Day: Visual Vocabulary

Inspired by the Graphic Continuum by Jon Schwabish and Severino Ribeca, the Financial Times graphic team came up with their own neat chart of visualizations. The Visual Vocabulary is a guide to help journalists pick the right type of visualization for their story.

GIJN’s Data Journalism Top 10: Pirates vs. Princesses, Buenos Aires Crime, Awards & Fellowships

What’s the global data journalism community tweeting about this week? Our NodeXL #ddj mapping from January 7 to 13, 2019 finds @SZ’s analysis revealing how children’s books perpetuate gender stereotypes, @A24COM mapping the hottest crime spots and times in Buenos Aires, @dw_akademie offering a data journalism fellowship opportunity, and great chances to win awards from @WorldGovSummit and @GENinnovate’s Data Journalism Awards.

GIJN’s Data Journalism Top 10: FT’s Chart Quiz, 65 Years of Human Rights Data, Build a Brexit Voter

What’s the global data journalism community tweeting about this week? Our NodeXL #ddj mapping from February 18 to 24 finds a fun @FinancialTimes quiz that tests your ability to read charts, the creation of a @DataVizSociety to foster engagement in the data visualization community and data viz designer @fedfragapane’s analysis of Human Rights Protection data from 1950 to 2014.

GIJN’s Data Journalism Top 10: New Tools for Chartmaking and Sonification, 3D Data, Hedgehog Maps, Editable Spreadsheet Images

What’s the global data journalism community tweeting about this week? Our NodeXL #ddj mapping from March 4 to 10 finds several interesting tools and feature releases: @FinancialTimes’ chartmaking tool, @datavized’s data sonification tool and a new feature on @Microsoft’s Excel app that converts printed tables into editable spreadsheets, as well as @alice_corona’s discussion of building 3D data experiences, and @alyssafowers coining the term “hedgehog maps.”

GIJN’s Data Journalism Top 10: Visualizing Air Raids, Dictator Decrees, Dataviz Crimes, Random Samples

What’s the global data journalism community tweeting about this week? Our NodeXL #ddj mapping from March 25 to 31 finds @ajlabs visualizing air raids through sound, @infobae exposing secret dictatorship decrees in Argentina, @albertocairo presenting on how charts can be misleading and how to fix them, and @TheEconomist laying bare the “crimes” against data visualization they have committed.

GIJN’s Data Journalism Top 10: Weak Passwords, Wolf Drama, Chart Chooser, London vs. England

What’s the global data journalism community tweeting about this week? Our NodeXL #ddj mapping from May 6 to 12 finds @SteveFranconeri’s chart chooser based on data formats instead of visualization functions, @daswasfehlt’s examination of Austrian politicians’ weak email passwords in the wake of a major data leak, @NZZ’s look at whether wolves are really a nuisance in Switzerland and @wihbey’s research into the data competence and partisanship of journalists.