freedom of information
Tips on Making FOIA Requests About COVID-19
|
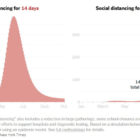
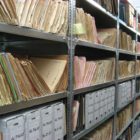
Despite government restrictions, journalists around the world are using freedom of information laws to understand the COVID-19 pandemic and the response of international, national, and local authorities. GIJN’s Toby McIntosh outlines how to craft an effective freedom of information request and provides tips and suggestions on where to make requests and important questions to ask.