Top 10 in Data Journalism
Data Journalism Top 10: Disinformation Ad Revenue, Bolsonaro’s Bubble, Russian Mobilization Marriages, Itaewon Tragedy
|
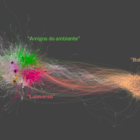
This week’s most popular data journalism stories on Twitter include how Google ads fuel disinformation, an analysis of the online bubble of pro-Bolsonaro tweets, what marriages tell us about Russian mobilization numbers, and a timeline of the Itaewon crowd crush tragedy.