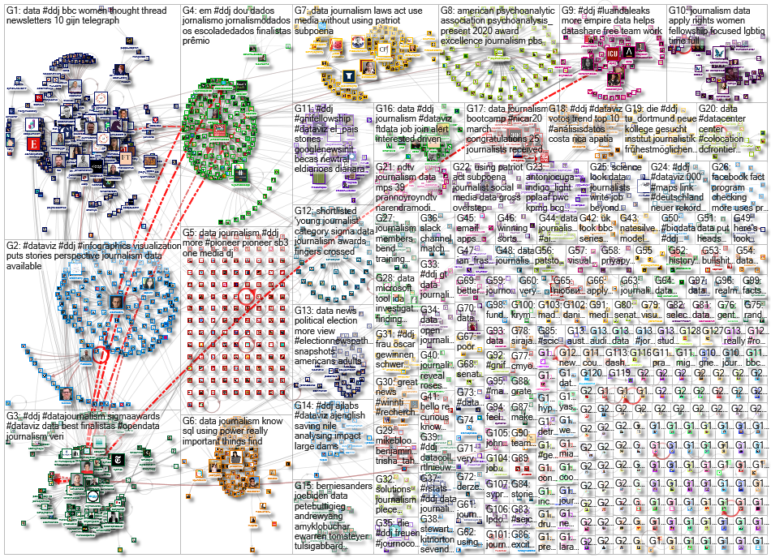
What’s the global data journalism community tweeting about this week? Our NodeXL #ddj mapping from February 10 to 16 finds The Guardian US analyzing food expenditure on the Democrats’ campaign trail, The Washington Post’s Steven Rich sharing the pains of cleaning spelling permutations in data, the International Consortium of Investigative Journalists explaining how it handled the massive #LuandaLeaks records, and the Sigma Awards announcing its shortlist.
Food Fuel on the Campaign Trail
The Democratic primaries in the United States can be grueling, and the campaign staff need sustenance to get through the marathon. Using records from the Federal Election Commission, The Guardian analyzed campaign expenditures on all things edible and discovered the cuisines of choice for each of the candidates on the campaign trail.
.@juliacarriew did an in-depth data analysis of nearly $2 million in campaign food spending, and you’ll never guess which campaign spent the most at Panera: https://t.co/2sutKb4dpi pic.twitter.com/PgIj4e2lu5
— Lois Beckett (@loisbeckett) February 10, 2020
Sigma Awards
For the inaugural Sigma Awards this year (which succeed the Data Journalism Awards), applicants submitted 510 data journalism projects produced in 2019 from 66 countries. A shortlist of 82 projects from 31 countries was chosen and the winners was just announced yesterday. See the winners here.
🥁Breaking news from the @sigmaawards 2020: The pre-jury has worked very hard and come up with a shortlist of the selected 82 entries throughout all categories. Congratulations to the preselected projects and best of luck on the next stage! https://t.co/YPNAAzP7bG #datajournalism pic.twitter.com/3hNc5b2NVe
— DataJournalism.com (@datajournalism) February 15, 2020
Data Cleaning Woes
Steven Rich, database editor for The Washington Post’s investigative team, posted a tragicomic tweet that echoes the pain experienced by data journalists everywhere: cleaning the myriad incredulous spelling permutations in data. Others who commiserate with Rich chimed in.
— Cidmonster (@Cidmonster) February 12, 2020
Visualizing Things in Perspective
News of the Democratic primaries in Iowa and New Hampshire may have dominated US news recently, but how much do they really matter, pondered data visualization expert Alberto Cairo. He highlighted a cartogram created by The Wall Street Journal’s Brian McGill which puts the primaries into perspective.
Data Visualisation often puts stories in perspective, another useful example that tempers the exaggeration already in the news about US Democratic candidates, from the ever watchful @AlbertoCairo https://t.co/3sKc9HxhKA #DataViz #Democrats2020 #Map pic.twitter.com/SpN3bsWN1E
— Paul Laughlin (@LaughlinPaul) February 13, 2020
Analyzing #LuandaLeaks
The Luanda Leaks is a collection of more than 715,000 financial and business records. Assuming each document is about 500 words long (or the equivalent in a spreadsheet), it would take more than two and a half years of non-stop reading for a single person to pore over every file. So how did the International Consortium of Investigative Journalists tackle the massive dataset? The team explains their process here.
.@ICIJorg used @Neo4J and @Linkurious to generate a database and create a visual representation of the networks within the Luanda Leaks hundreds of thousands of records. https://t.co/riPGWh6BMR
— Sébastien Heymann (@mentatseb) February 3, 2020
Toxic Legacy of Old Oil Wells
Fossil fuel companies are leaving thousands of oil and gas wells unplugged and idle across California, potentially threatening the health of people living nearby and handing taxpayers a multibillion-dollar bill for the environmental cleanup. The Los Angeles Times and the Center for Public Integrity investigated the state’s withering oil industry, its consequences, and created an interactive map where residents can check if they live within 600 feet of one of California’s 70,000 active or 35,000 idle wells.
Across California, thousands of oil and gas wells have been left unplugged, which can contaminate water supplies and fumes can creep into homes. Fossil fuel companies may be sticking the state with the bill for clean up.
Powerful reporting https://t.co/1MOu3hSn4D
— Kiera Feldman 🦅 (@kierafeldman) February 9, 2020
State of Data Journalism in Asia
Marianne Bouchart interviews Darren Long, creative director of South China Morning Post, on the state of data journalism in Asia, the relationship between graphics and data, and what data journalists can learn from the SCMP’s graphics team. Read the original article in English and in Portuguese on IJNet.
Nesta entrevista, @darrenlonghk fala sobre o estado do jornalismo de dados na Ásia, a relação entre gráficos e dados e o que os jornalistas de dados podem aprender com a equipe de design do @SCMPNews https://t.co/pKVVZYhu9l
— IJNet em Português (@IJNetPortugues) February 5, 2020
Funding Buses in England
British Prime Minister Boris Johnson is pledging £5 billion ($6.5 billion) over five years to boost bus services and cycling in England. Transport campaigners want the money to be used to restore “lost” routes in “disconnected” rural areas. The BBC investigated bus usage across the country to find out where the new bus funding would make the most difference. The data is available on Github.
You may have seen that £5bn has been pledged by @BorisJohnson to help bus services and cycling routes. Campaigners are calling for this money to go to "disconnected" rural areas – @danwainwright and I have been looking at it this morning #transport #buseshttps://t.co/40XrnkrpdB
— Rob England (@England_Rob_) February 11, 2020
Data Journalism UK 2020
Data journalists from across the UK will gather in Birmingham on April 23, 2020, to talk about cutting edge reporting, techniques for finding stories in structured information, and how great data journalism works. Registration is now open, and bursaries are available to support travel and other costs for attendees with low incomes and from under-represented groups. Details here.
🤫 https://t.co/7tPDP2dhLY #DJUK20
— Paul Bradshaw (@paulbradshaw) February 14, 2020
Computation + Journalism Symposium 2020
The Computation + Journalism Symposium, now in its ninth year as a national-global conference, is a celebration and synthesis of new ways to find and tell news stories with, by, and about data and algorithms. This year, it will be hosted by Northeastern University in Boston on March 20 and 21. Keynote speakers include Amanda Cox, Deen Freelon, and David Rothschild.
Tick-tock, getting close: Reg today for Computation +Journalism conf — Intersection between data and computer science & journalism. Limited number of discounted hotel rooms available. March 20-21. Pls RT https://t.co/1CKAS3m4Bb #journalism #media #datavis #dataviz .
— Matt Carroll (@MattCData) February 18, 2020
Thanks again to Marc Smith of Connected Action for gathering the links and graphing them. The Top Ten #ddj list is curated weekly.
 Eunice Au is GIJN’s program coordinator. Previously, she was a Malaysia correspondent for Singapore’s The Straits Times, and a journalist at the New Straits Times. She has also written for The Sun, Malaysian Today, and Madam Chair.
For a look at NodeXL’s mapping on #ddj and data journalism on Twitter, check out this map.