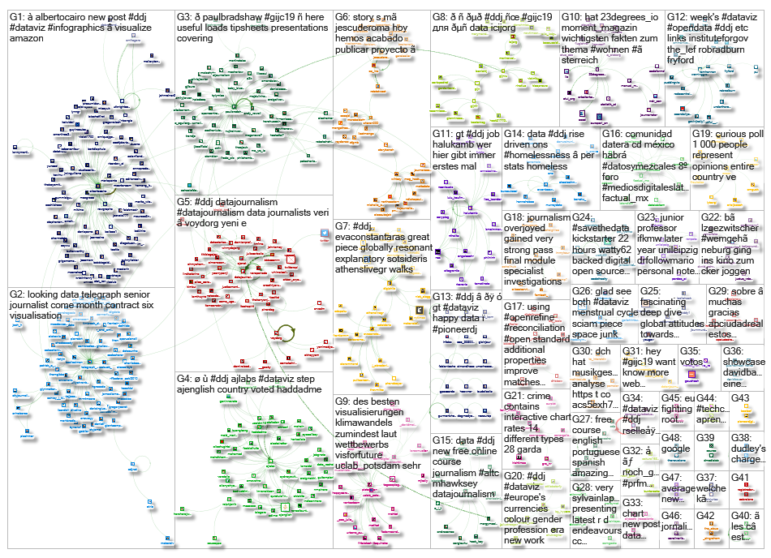
What’s the global data journalism community tweeting about this week? Our NodeXL #ddj mapping from September 30 to Oct 6 finds Al Jazeera Labs analyzing key issues debated and voted at the UN General Assembly since 1946, Datajournalism.com gathering expert advice on data journalism during natural disasters, the Knight Center for Journalism in the Americas offering a free data visualization course in three languages, and Pinar Dag at our own #GIJC19 on how small newsrooms can do big data stories.
Key Issues at the UN
Every September, leaders worldwide gather at the United Nations General Assembly to examine the biggest issues facing the planet. To understand the key issues debated and voted upon by the UN members states over the decades, Al Jazeera Labs analyzed the voting patterns from 1946 to 2018. Read about their process here.
Wow. Just wow. On the occasion of the 74th session of the General Assembly Al Jazeera put together an immensely impressive data piece on the history of votes, discussions, etc. Early Christmas present for int law & IR nerds #dataviz #ddj @AJLabs @AJEnglish https://t.co/i2cI4gykEb
— Ralph Janik (@RalphJanik) September 24, 2019
Data Journalism in Disaster Zones
Datajournalism.com spoke to a group of seasoned data journalists about how to overcome the challenges of deficient data and data unreliability during natural disasters, as well as how to improve data journalism and visualizations when reporting on these disasters.
This is how #datajournalism can promote better reporting in disaster areas #ddj @datajournalism https://t.co/tNdl33n7ST
— Joshua Mutisya (@TheKenyanJoshua) September 18, 2019
Small Newsroom, Big Data Stories
Trying to do data-driven stories while meeting the demands of working in a small newsroom can seem overwhelming. At the 11th Global Investigative Journalism Conference in Hamburg (#GIJC19), data journalism lecturer Pinar Dag shared strategies on how to overcome the challenges small newsrooms often confront while trying to do data journalism. Her presentation can be found here. More GIJC19 tipsheets here.
Many hands-on sessions at #GIJC19, like @pinardag‘s class on how small newsrooms can work on great data journalism projects. It doesn’t have to be the Panama Papers. Small data sets can lead to big stories, too. pic.twitter.com/ajyZAtVzg8
— Denise Hruby (@nisnis) September 28, 2019
Free Data Visualization Course
The Knight Center for Journalism in the Americas is offering a free, six-week, massive open online course titled “Data Journalism and Visualization with Free Tools.” Learn from data visualization experts such as Simon Rogers, Alberto Cairo, and many more about how to find and get data, prepare data, find stories in data, visualize data, and more. The course is offered in English, Spanish, and Portuguese.
Join the more than 6,000 students who have signed up for our new FREE online course on data journalism and visualization with free tools in English, Spanish and Portuguese! https://t.co/AY9yO3deuU pic.twitter.com/gyFQ4tmqmQ
— UT Knight Center (@utknightcenter) October 4, 2019
Explain Uncertainty
Data visualization expert Alberto Cairo wrote a critique on a piece in The New York Times by MIT Election Lab’s Alexander Agadjanian. In his post, Cairo points out that the graphs in the article lacked explanations of the data’s uncertainty, and he offered a suggestion of captions to improve the visualizations.
Alberto Cairo: Don't just visualize uncertainty; explain it, and don't let captions contradict it https://t.co/3gJ7xYg7y4 pic.twitter.com/I7GgMnAmlC
— Journalism.co.uk (@journalism) October 1, 2019
Support on Indiegogo: RAWGraphs 2.0
Have you used RAWGraphs before? It is a free and open source software that helps you visualize data in spreadsheets without coding skills. The software is now two years old and the team behind it launched an Indiegogo crowdfunding campaign to fund improvements of the technology behind the app and add a bunch of new features.
If you work on #datavis, you may be familiar with @rawgraphs, which is an amazing open source tool for the job. And now they have an @Indiegogo campaign for RAWGraphs 2.0, which you *should* contribute to: https://t.co/6FnkPA5Yzn
— Ale Muñoz (@bomberstudios) October 1, 2019
The Exodus Project
El Confidencial did a microdata analysis of Spain’s internal and external migration data from 1988 to 2018, based on data from the country’s National Statistics Institute, and then visualized it here. Data on Github.
¿Sabes cuántas personas han llegado a tu ciudad procedentes de otras provincias en los últimos 30 años? ¿Y cuántas han salido? Nuestro buscador tiene todos los datos https://t.co/ee3keo1nSV pic.twitter.com/ahqDG0SbTA
— El Confidencial (@elconfidencial) September 27, 2019
News Data Journalism vs. Finance Dataviz
Former Bloomberg Businessweek data journalist Toph Tucker shares his observations on the similarities and differences in his transition from making charts for news to making charts for banks.
So, so many amazing observations and ideas in here on UX, finance, specialisation, how people do… things, everything!
The density of concepts is off the charts in this @tophtucker brain dump. https://t.co/4QK7GH7p5f
— Mitch (@mitch_oneill) October 5, 2019
Most Deprived Neighborhood in England
England’s Ministry of Housing, Communities and Local Government revealed that a majority of the most deprived neighborhoods are in the north of the country, with seaside village Jaywick taking the top spot. The statistics were based on levels of income, employment, education, health, and crime as well as housing services and living environment. Data on Github.
BBC story on England's 'most deprived areas' was done with R
Story: https://t.co/90km0bxkjJ
GitHub repo: https://t.co/moKWfAfvqD#rstats #ddj— Sharon Machlis (@sharon000) October 2, 2019
Data Journalism Bulletin (in Turkish)
The weekly data bulletin produced by the Data Literacy Association (Veri Okuryazarlığı Derneği) has reached its 50th edition. If you’re doing data journalism in Turkish, you’ll want to subscribe here.
📣Haftalık yayınladığımız Veri Bülteni #50 sayısıyla yayında!
📈Keyifli okumalar:https://t.co/247xECtquV
📩Bülten e-postama gelsin diyenleri şuraya alalım https://t.co/VQtlgNQaKG#ddj #dataviz #açıkveri #opendata #datajournalism #verigazeteciliği #verigörselleştirme pic.twitter.com/61L4Sq9kUn
— VOYD (@voydorg) October 6, 2019
Thanks, once again, to Marc Smith of Connected Action for gathering the links and graphing them. The Top Ten #ddj list is curated weekly.
 Eunice Au is GIJN’s program coordinator. Previously, she was a Malaysia correspondent for Singapore’s The Straits Times, and a journalist at the New Straits Times. She has also written for The Sun, Malaysian Today and Madam Chair.
For a look at Marc Smith’s mapping on #ddj on Twitter, check out this map.