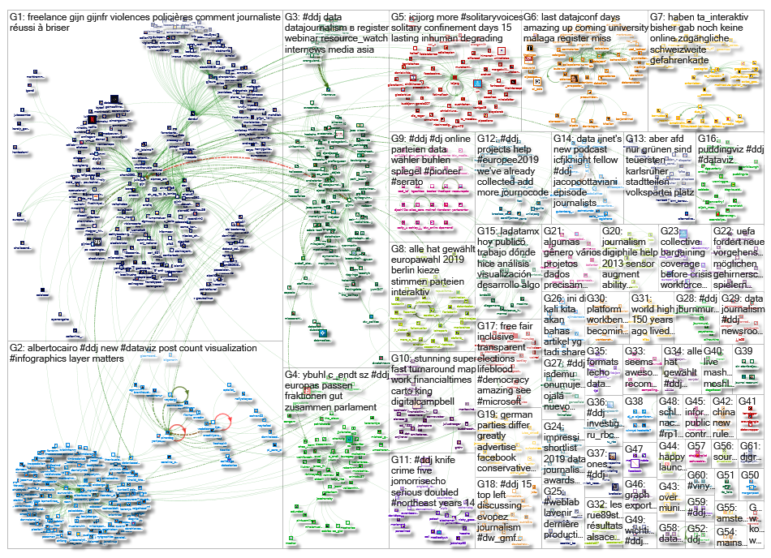
What’s the global data journalism community tweeting about this week? Our NodeXL #ddj mapping from May 27 to June 2 finds immense buzz around the recent European Parliament elections, with @SZ explaining the EU political landscape, @morgenpost looking at the results in Berlin, and @journocode collecting data journalism pieces related to the election. There’s also @datajournalism‘s tips on presenting data through audio and @BIRNSrbija‘s data investigation into major corporate tax fraud in Serbia.
Presenting Data Through Audio
Data journalism is typically associated with data visualization, but it can be presented for the ears as well as the eyes. A mix of journalists and experts — Sophie Chou, Michael Corey, Adèle Humbert, Petr Kočí, Jacques Marcoux and Paul McNally — shared tips and techniques for representing data through audio.
When we think of data journalism, we usually don't think of #radio. So, in our new guide to producing data stories for radio, we got six experts together to change your thinking: https://t.co/dvQIjfrckL @mikejcorey @AdeleHumbert @jacquesmarcoux @mpetitchou @tocit @mcnallypm #ddj pic.twitter.com/4763toCgCw
— DataJournalism.com (@datajournalism) May 28, 2019
Test Your European Knowledge
In the same vein as The New York Times’ “You Draw It” interactives, BR24 has produced 10 interactive quizzes for you to test your knowledge of the European Union. The questions range from whether citizens trust the European Parliament to which EU country has the highest proportion of foreigners.
Die KollegInnen von @br_data / @BR_Recherche haben da eine mega tolle Website zur #EU gebaut. War ziemlich überrascht bei einigen Antworten 😅#Europawahl2019 #EU19 https://t.co/peIYTxeuS4 pic.twitter.com/VgMiUBhe8a
— Laura Goudkamp (@Summa_Cum_Laura) May 22, 2019
Explaining the European Party Landscape
The recently elected members of the European Parliament come from 28 different countries and 181 different national parties. In order to work effectively, these parties join forces to form transnational groups. Süddeutsche Zeitung tries to explain where these groups lie on the political spectrum and how they fit together.
So sieht Europas Parteienlandschaft aus. Leseempfehlung für das digitale Lehrstück der Kollegen @c_endt und @YBuhl über die europäischen Fraktionen #ddj #Europawahl19 @SZ https://t.co/5IMAJKVovd pic.twitter.com/z2swZXqaiD
— Vanessa Wormer (@Remrow) June 1, 2019
European Election Card in Berlin
Berliner Morgenpost created an interactive map showing how Berliners voted in the recent European election. Check out which were the three strongest forces, the districts that changed hands, places where non-voters could have swung the vote, and more.
The Europawahl map is up and, once again, features stats on independent constituencies so you can see what percentage of your direct neighbors voted for the far right: https://t.co/V5yaf3gqKv pic.twitter.com/dIsvW3ojMQ
— nathan marx (@nthnashma) May 27, 2019
More on the European Election
Interested in more European election data journalism stories? Journocode has collected more than 30 here and are asking for more contributions here. Datajournalism.com also has a newsletter on how data journalists tackled coverage of the election here.
These are the #Europee2019 #ddj projects we've already collected: https://t.co/fSv6LXNM7q 🇪🇺🤖 Help us add more: https://t.co/8aOcNRwZN6 pic.twitter.com/T05rBEQR18
— Journocode (@journocode) May 27, 2019
Parserator
Parserator is not a new tool, but it comes in handy for parsing messy and large volumes of addresses, names or any unstructured text into useful components. Data Journalism Turkey recommends it here. More details on Github.
Parserator: Yapılandırılmamış içeriği veriye dönüştürmeyi sağlar!⚙️⛏️https://t.co/sBSpeBSQvP #veritemizleme #veriyapılandırma #ddj #vg #dataviz pic.twitter.com/Qit8zHXQ82
— Açık Veri Gazeteciliği PlatformuTR (@DagmedyaVeri) May 30, 2019
#FollowFriday: @albertocairo
Interested in data visualization and how you can make your infographics better? Follow data viz expert Alberto Cairo’s blog. He provides constructive critiques on existing charts, tips and food for thought.
Recent posts:
• Migration flows in the European Union: https://t.co/Am02jcNlX9
• The “me” layer in visualization: https://t.co/bsfJ6Tj1WJ
• In visualization, what you count and how you count it matter: https://t.co/hli0dmhmA6#HowChartsLie #dataviz #infographics #ddj pic.twitter.com/OS5AtOTrPc
— Alberto Cairo (@AlbertoCairo) June 1, 2019
Data Investigation Into Tax Fraud
BIRN Serbia investigates a huge corporate and tax fraud scheme in Serbia involving more than 2,000 companies that have successfully avoided paying tens of millions of euros in taxes.
Excellent data investigation from @BIRNSrbija revealing the loopholes used to obliterate corporate debt and the cottage industry that profits from them https://t.co/sjieyT2dBl
— Jack Davies (@jackoozell) May 31, 2019
Hungary’s Residency Permit Boom
The number of residency permits in Hungary issued to non-EU nationals increased dramatically in 2017. Atlatszo visualized the data of permits issued for different reasons from 2009 to 2017. You can also filter by country.
In 2017 Hungary gave 117.000 residence permits for non-EU citizens (+120% growth Y/Y). 73.000 (mostly Chinese, Russian and Ukrainian) received it for "other reasons" aka "diplomat, consular officer treated as exempt from control." #ddj https://t.co/xYCLVoTM9h
— Attila Bátorfy (@attilabatorfy) May 27, 2019
Webinar: Open Data Asia
Resource Watch, Earth Journalism Network and Internews are organizing a training webinar for journalists based in Asia on June 12. Explore how you can utilize public datasets for your reporting.
Make sure to register for Webinar with @resource_watch @Internews & EJN. Focus is on media in Asia – and will explain the platform's hundreds of open #data sets and useful features in your reporting. Spread the word! June 12th – 11AM ICT #DataStories #ddjhttps://t.co/5MxsYnGQ0Q pic.twitter.com/2Rjhy2A4Np
— Earth Journalism Network (@earthjournalism) May 31, 2019
Thanks, once again, to Marc Smith of Connected Action for gathering the links and graphing them. The Top Ten #ddj list is curated weekly.
 Eunice Au is GIJN’s program coordinator. Previously, she was a Malaysia correspondent for Singapore’s The Straits Times, and a journalist at the New Straits Times. She has also written for The Sun, Malaysian Today and Madam Chair.
For a look at Marc Smith’s mapping on #ddj on Twitter, check out this map.