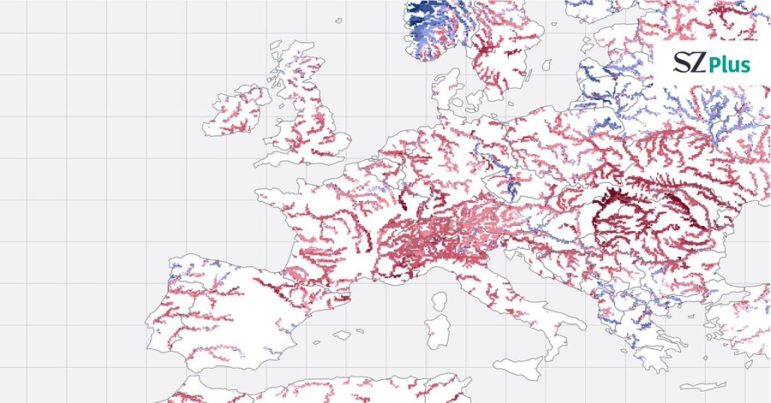
Süddeutsche Zeitung mapped the water levels of rivers in Europe. Image: SZ.
Even as floods devastate Asia and other parts of the world, low river levels are increasingly harming agriculture, energy, and the economy across Europe. After months of intense heat waves, that continent is now suffering from extreme drought, which is changing the landscape of several countries. Our weekly NodeXL and human curation of the most popular data journalism stories on Twitter spotlights Süddeutsche Zeitung’s visualizations of the water levels of European rivers over the last few decades, as well as possible explanations for the phenomenon. Also this week, we look at student loan debt relief in the US, NASA’s plans to return to the moon, and how Russia’s war in Ukraine compares to other modern conflicts.
Too Dry to Handle
Europe’s rivers carry less water than ever before. Across most of the continent, famous rivers are now unrecognizable. The extreme drought, which has affected several regions this year, reached a new peak in August in what could be the driest European summer in 500 years, according to a report by the EU’s Joint Research Centre. According to analysis by German newspaper Süddeutsche Zeitung, the frequency of droughts in Europe is caused by an increase in average temperature across the continent, which leads to more evaporation and less water in the soil, and is strongly correlated to climate change. Reuters also broke down which countries are suffering the most, as well as the toll on agriculture and energy production.
A single map for the worst #drought in 500 years in Europe. The river discharge anomaly based on reanalysis data from June to August 12 2022, shows an average negative anomaly of -29%, even reaching less than -62% at some points. #rstats #dataviz pic.twitter.com/LSGMfS52Lm
— Dr. Dominic Royé (@dr_xeo) August 14, 2022
Relieving Student Debt
One in five Americans rely on loans, federal or private, to cover university costs. Higher tuition and cost of living, lack of professional growth prospects, and falling state share of higher education funding are some of the factors that have contributed to the current value of federal student debt: US $1.6 trillion, a figure nearly the size of the Australian economy. On August 24, President Joe Biden announced that he intends to cancel a significant amount of that debt: up to $10,000 for borrowers who earn less than $125,000 per year or $20,000 in forgiveness for those who received grants for lower-income students. To help borrowers know if they are eligible for student debt forgiveness, and what the amount would be, The Washington Post created a calculator that takes into account eligibility criteria such as personal income in the past two years, degree pursued, and tax filing status.
Here’s a tool to figure out whether you qualify for student debt forgiveness, and how much you might be able to apply to your federal loans. https://t.co/PtOZbZDIPO
— The Washington Post (@washingtonpost) August 25, 2022
China-Taiwan Conflict
In early August, US House of Representatives Speaker Nancy Pelosi visited Taiwan, defying warnings and threats from China and concerns from the White House. Less than an hour after Pelosi’s plane landed, the Chinese army announced that it would hold military drills near Taiwan in the coming days, in an attempt to intimidate the island’s government. China sees Taiwan as a separatist province that will one day return to its control. The New York Times reported that a Chinese invasion of Taiwan would likely involve a blockade — cutting off the island from the rest of the world physically, economically, and even digitally. Journalists mapped out the likely blockade scenarios and how it could disrupt life in and around the island.
Latest mapping project 🗺️! For decades, Beijing has had its sights on Taiwan. While China likely lacks the ability to quickly seize the island, it could try to subdue it by cutting it off physically, economically and digitally. https://t.co/EzESGtkXZT pic.twitter.com/qq6lzrJUDO
— Pablo Robles (@pabloroblesg) August 27, 2022
Tallying Six Months of War in Ukraine
It has been more than six months since Russian troops invaded Ukraine. To put the scale of the war in historical context, exiled independent news website Meduza compared data from the war with eight other modern conflicts over the past 70 years, such as the US-Vietnam War and the Iran-Iraq War, chosen for their political significance and the type of warfare. Among the data compared: number of deaths, size of conflict area, and amount of troops on both sides. Also worth a look: Al Jazeera created a detailed timeline with maps and satellite images, breaking down key events of the invasion, such as troop movements and the before and after of attacked territories.
With Russia's full-scale war against Ukraine now half a year old, Meduza used available data to see how it compares to eight other major conflicts of the last 70 years.https://t.co/b7yHmqe7YS
— Meduza in English (@meduza_en) August 24, 2022
To the Moon… and Beyond!
Fifty-three years ago, Neil Armstrong took one small step for man, one giant leap for mankind as the first human to walk on the moon. Now, decades later, NASA is planning another ambitious campaign, which will include the first female and first person-of-color astronaut landing on the moon. Artemis I, the initial step in the program, costing about US$93 billion, will be an un-crewed test flight around the moon. The Artemis I mission also marks the first flight of NASA’s new mega-rocket, the Space Launch System, detailed in this visual guide from National Geographic, which includes how the spacecraft works and a comparison with rockets from previous missions. The Artemis I launch is now scheduled for this Saturday, after several delays.
NASA aims to land the first astronauts on the moon since 1972—including the first woman and the first person of color—as soon as 2025. Here's how: https://t.co/mf5W9FEZGR pic.twitter.com/eRQBnj7jWt
— National Geographic (@NatGeo) August 26, 2022
Hot Dawns in Spain
The phenomenon in which the minimum daily temperature does not drop below 20ºC, especially at dawn, is known as a “tropical night.” And it is becoming increasingly common in Spain. According to an analysis by elDiario.es, using data from the Agência Estatal de Meteorología (AEMET), the hottest nights have multiplied in recent decades and hit a record in 2022 in 40 of the 52 Spanish provinces. In Barcelona, for example, the number of tropical nights has tripled in recent decades, while in the capital, Madrid, the number is four times higher. The phenomenon, which is explained as an effect of heat islands and global warming, also has implications for the health of the Spanish population, as it can make sleep difficult and increases mortality during nighttime heat waves.
🌡️Dormir en verano cada vez es más complicado: así se han multiplicado las noches tropicales en las ciudades españolas por el calentamiento global y el crecimiento urbano
Datos de @AEMET_Esp analizados con @VictriaVic y @CarmenMartnezV4 https://t.co/JeLBFcyRLu pic.twitter.com/RdrDWsqfKF
— Raúl Sánchez 📈 (@raulsanchezglez) August 26, 2022
Tracking a Stolen Truck
Reporter Greg Rosalsky, from NPR, had his car stolen three times in just one year after moving to San Francisco. Because his car was a beat-up 1999 Toyota Tacoma, he never understood the motivation behind the robberies and felt the urge to investigate the black market in stolen cars. He discovered that, to his surprise, it is not the best and newest cars that are stolen, but older ones that lack technologies such as an electronic engine immobilizer. The advent of that device was responsible for dramatically reducing car theft numbers from the 1990s to the present. Unfortunately, this technology wasn’t present in Rosalsky’s 23-year-old truck, so now he’s looking for a new vehicle.
Someone stole my truck and all I got was this article. https://t.co/8m43DONCS1
— Greg Rosalsky (@elliswonk) August 23, 2022
A Summer of Record Fires
In addition to droughts and heat waves, already noted in other stories this week, another phenomenon has caught global attention in 2022: fires. According to data from the European Forest Fire Information System (EFFIS), which tracks fires detected by satellite images, the area burned in France through August 20 totaled more than 62,000 hectares, a record. That figure is 7.5 times higher than the annual average of the previous 15 years and even exceeds the previous single-year record, with four months still to go. To show the extent of these fires, Le Monde created a series of maps and graphs to show the situation in the country, as well as an interactive visualization that allows you to see the size of the burned area in a map.
Incendies : six cartes et graphiques qui montrent un premier bilan inédit de l’été https://t.co/z11HpRqxDQ pic.twitter.com/Jv3NwcQ5VR
— Les Décodeurs (@decodeurs) August 22, 2022
100 Episodes of Censorship
What is the extent of censorship of foreign content in China? After noticing some inconsistencies while watching one of her favorite TV shows on Youku, a Chinese video streaming website, reporter Manyun Zou decided to sit down and watch the first 100 episodes of the original version of The Big Bang Theory, side by side with the edited Chinese version. She noticed over 200 deleted scenes, equal to nearly three full episodes. Among the main moments that disappeared: references to sex and to the LGBTQ+ community, and “disrespect” toward China or the country’s allies, such as North Korea.
What kind of media does the Chinese government censor? Our author @Manyun_Zou watched the first 100 episodes of the Big Bang Theory to find out. The Big [Censored] Theory is out!https://t.co/aRAYG89gOT#thebigbangtheory #sheldoncooper #censorship #chinesetv #chinauncensored
— The Pudding (@puddingviz) August 29, 2022
Dataviz Awards
The Information is Beautiful Awards are back! After almost three years, the award that celebrates excellence and beauty in data visualizations and infographics is open for submissions until September 18. There are 10 categories open for works published between September 1, 2019 and August 31, 2022. All entries must be data-driven, with visual components. Read more about the guidelines of the awards here.
It’s time…The 2022 Information is Beautiful Awards are now open for submissions! Submit your work, or nudge colleagues and people you admire to submit. Help us spread the word! #dataviz #IIBAwards
Submit here: https://t.co/wM60zw5QoW pic.twitter.com/BGbVZCZ8NI
— Data Visualization Society (@DataVizSociety) August 25, 2022
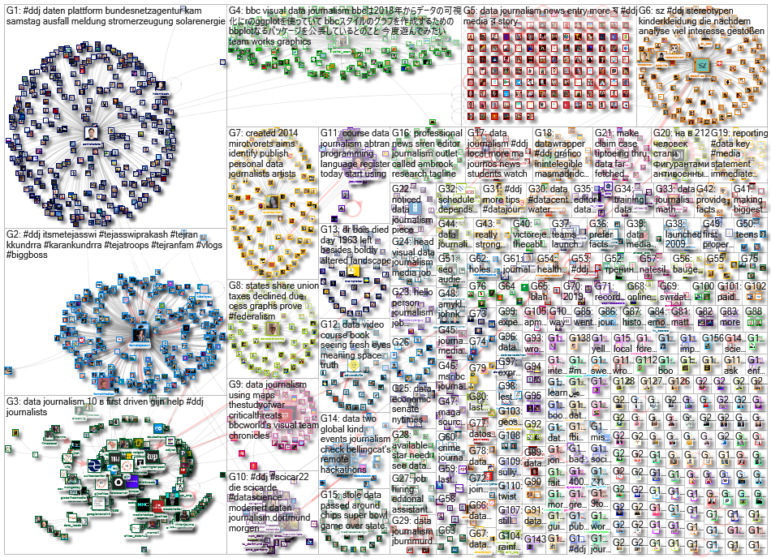
Thanks again to Marc Smith and Harald Meier of Connected Action for gathering the links and graphing them. The Top Ten #ddj list is curated weekly.The Top Ten #ddj list is curated weekly.
 Ana Beatriz Assam is GIJN’s Portuguese Editor and a Brazilian journalist. She has been a freelance reporter for the newspaper O Estado de São Paulo and worked with the Brazilian Association of Investigative Journalism (Abraji). She holds a BA in Social Communications: Journalism from São Paulo State University.
