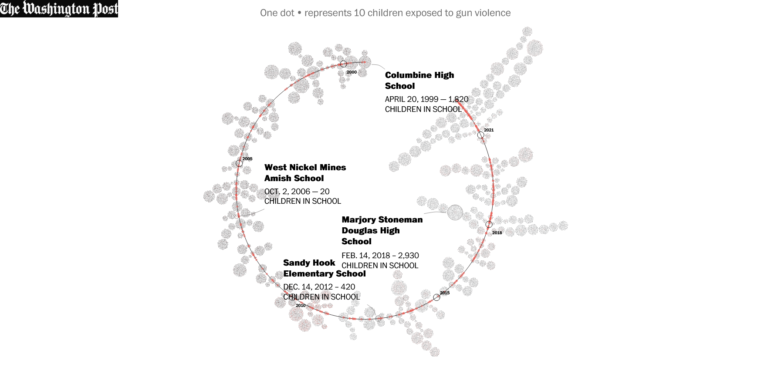
The Washington Post has kept track of the number of US children exposed to gun violence during school hours. Image: Screenshot.
This week, a highlight of data journalism was The Washington Post database and analysis of school shootings in the United States. Created from scratch and constantly updated, it reveals some startling figures, like the fact that more than 300,000 US primary school students have been exposed to shootings in the past 23 years. Our weekly NodeXL and human curation of the most popular data journalism stories on Twitter also looks at visualizations showing the faces of those imprisoned in China’s Uyghur detention camps, historical heat records in the US, migrants at the Polish-Belarus border, suspiciously heavy parcels sent back home by Russian troops in Ukraine, and the toll of suicide in European jails.
Tracking Gun Violence
The US federal government does not track school shootings, so The Washington Post created its own database in 2018. Using Nexis, news articles, open-source databases, law enforcement reports, school websites, and calls to schools and police departments, the paper tracked how many children had been exposed to gun violence during school hours since the Columbine High massacre in 1999. The count: more than 311,000 children at 331 schools. The Post updated the database in light of the recent school shooting incident in Uvalde, Texas, which claimed the lives of two teachers and 19 children. Among the findings: a disproportionate impact of school shootings on children of color, and a median age of school shooters of 16. The Post also looked at causes of death and found that guns have overtaken car accidents as the leading cause of death among American young people.
The Washington Post has been counting children exposed to gun violence at school since Columbine. Here’s what our visualization looked like when we first published the page in 2018 (200,000 children exposed) and today with the count now surpassing 300,000. https://t.co/UPhjOKmmQz pic.twitter.com/CaS3cQPALs
— John Muyskens (@JohnMuyskens) May 25, 2022
The Faces of Interned Uyghurs
The Xinjiang Police Files is a leaked set of 452 spreadsheets that include the names, addresses, identification numbers, and photographs of more than 20,000 Uyghurs and other minorities detained in mass internment camps in Xinjiang, China. The data originates from a source who claimed he hacked, downloaded, and decrypted the information from police servers in the region. The BBC and more than a dozen other news organizations examined and verified the documents, which painted a picture of prison-like conditions in camps that Chinese officials claim are “vocational schools.”
I’m usually down on legacy media, but this superb BBC exposure of police files on Uyghurs and other minorities, brutally detained by the CCP, deserves wide exposure. This is what good journalism is all about. https://t.co/6cKHhIPVQ9
— David Asman (@DavidAsmanfox) May 29, 2022
Gamifying Therapy Wait Times
German public broadcaster rbb|24 developed a newsgame to illustrate how problematic waiting times for therapy can be in Germany. To gather enough data and context, journalists called hundreds of therapists across the country and tried to book an appointment. The team not only discovered the importance of storytelling to make the game more immersive, but also the need to incorporate user testing before publication. “The first version looked completely different to the current one,” data journalist Haluka Maier-Borst said in a tweet thread in which he shared behind-the-scenes insights of the piece.
So, we are not the first. We are probably not even the tenth news outlet to make a #newsgame. But still we did it @rbb24. And it gave us a new way to explain users how problematic long waiting times for therapy can be. And we also learned a lot.
— Haluka Maier-Borst (@HalukaMB) May 29, 2022
Migrants on the Poland-Belarus Border
Using exclusive data, geolocation, phone records, videos, documents, and interviews, the Balkan Insight team pieced together a picture of how migrants are trapped in a kind of nightmare limbo at the Poland-Belarus border. Journalists examined records of more than 4,000 migrants, split into over 600 groups, who tried to cross into Poland in 2021 and 2022. It found at least 59 groups had experienced pushbacks, some multiple times, from border guards, and 26 groups had suffered violence from the authorities.
The most complete data on migrants on the PL-Belarus border show that an overwhelming number of them were likely eligible candidates for asylum, according to an investigation by @BalkanInsight funded by the Investigative Journalism for Europe Fund (IJ4EU).https://t.co/dPZzmZ6Znz
— Claudia Ciobanu (@Claudia_Warsaw) May 23, 2022
78 Long Minutes
It took 78 minutes from when families learned that a shooter had entered Robb Elementary School in Uvalde, Texas, to the time officers entered the classroom and shot the gunman dead. The New York Times reconstructed the events in that excruciatingly long period, minute by minute, using video evidence, statements by witnesses and law enforcement, and 911 calls. By presenting key incidents in a scrollytelling timeline, the newspaper managed to convey to readers the never-ending agony that the families had to endure waiting for a resolution.
A team of us at @nytgraphics spent the last two days making this, an attempt to convey the agony of 78 long minutes.https://t.co/mTSrAebVgY
— Keith Collins (@collinskeith) May 29, 2022
Mapping Russian Looting
Russian independent journalism outlet Mediazona tracked how members of the Russian military have sent back 58 tons of parcels from Ukraine since a few days before the invasion. Journalists identified an unusual increase in shipments, suspiciously heavy packages, and deliveries from locations that coincide with Russia’s major strategic thrusts into Ukraine. The analysis suggests that the packages were likely items looted from inside the country. By analyzing video footage, the team determined that soldiers had sent home items such as sneakers, car tires, a microphone, a TV, sausages and canned food, a guitar, a tent, and even a military drone. Read the story in English and Russian.
New @mediazzzona investigation into Russian looting in Ukraine reveals that Russian troops have shipped some 58 tons (!) worth of parcels back home. And there’s reason to believe they’re robbing their own military too. https://t.co/xXr1w6G8JK pic.twitter.com/nZc2FcJR1o
— Eilish Hart (@EilishHart) May 26, 2022
Cost of a Gas Calculator
Planning a summer road trip in the United States? Your budget won’t get you nearly as far as it did pre-pandemic. According to The Washington Post’s analysis of data from the American Automobile Association, gas prices are up more than 60 percent compared to the prices in 2019. Using tools like TravelTime and Mapbox, as well as data from Bloomberg, the Environmental Protection Agency, and the National Park Service, the newspaper developed a gas calculator for its readers to estimate the cost of fuel for their planned journeys.
I am OBSESSED with the maps in this piece by @juledurg @lmshap @n_kirkpatrick 😍
Summer road trip? This gas calculator can help you see your costs.https://t.co/yCbAkKpDKc pic.twitter.com/VQE8s2A6eu
— Lauren Tierney (@tierneyl) May 27, 2022
Suicide Among Pretrial Detainees
A collaborative investigation by Spanish media nonprofit Civio and other media partners examined suicide rates among prisoners in European jails. Journalists found alarming statistics: there were 17.5 suicides per 10,000 people in pretrial detention, while the proportion was 8.54 deaths in the rest of the prison population. The story also highlights countries with the highest pretrial prison suicide rates in Europe: Czech Republic, Latvia, and France.
🇫🇷 En 2021, l'#Europe 🇪🇺 a enregistré 17,5 #suicides pour 10 000 prisonniers en détention provisoire, contre 8,54 suicides pour 10 000 dans le reste de la population carcérale @civiohttps://t.co/Yc5jcRoKa0
— European Data Journalism Network (@EdjNet) May 24, 2022
Heat Records in US Cities
Did your city set a new record for its daily high temperature yesterday? Find out using The Pudding’s interactive, which draws temperature records of approximately 400 US cities from the Applied Climate Information System (ACIS). Readers can discover where yesterday’s temperature ranked historically for their city and when the last heat record was set.
New project! We’re tracking daily heat records for 400 U.S. cities. See where yesterday’s temperature ranked historically for your city and when the last record was set. https://t.co/iDPe1kqbDV pic.twitter.com/RJiZOLVld1
— The Pudding (@puddingviz) May 24, 2022
Financial Disparities in European Football
The Financial Times’ John Burn-Murdoch took a look at how the widening financial gulf between clubs in the European football Premier League and other leagues is degrading competition, resulting in the dominance of “superclubs.” The data shows that, in the early 1990s, the European Cup was far more cosmopolitan, with clubs from 13 countries including Serbia and Romania reaching the semifinals. But in the past five years, three-quarters of semifinalists came from just five urban Western European regions: Paris, Madrid, Munich, London, and the northwest of England. Burn-Murdoch expands on his piece with more details in a Twitter thread.
NEW: ahead of Champions League final, we need to talk about financial disparities in football.
For decades the sport has been quietly having its "frog in a pan of water" moment, and it feels like we’re approaching boiling point.
My column https://t.co/lfunC7p4v0
And a thread:
— John Burn-Murdoch (@jburnmurdoch) May 28, 2022
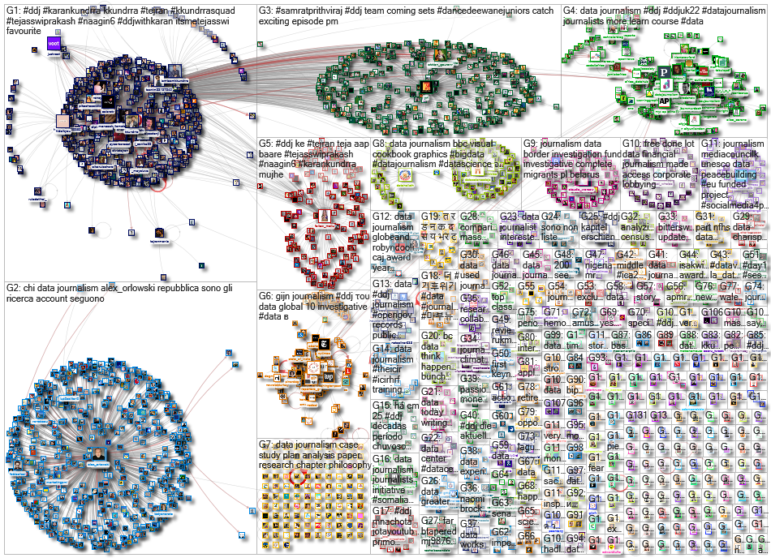
Thanks again to Marc Smith and Harald Meier of Connected Action for gathering the links and graphing them. The Top Ten #ddj list is curated weekly.
 Marthe Rubio is GIJN’s French editor. After working for five years in Spain and Argentina, she is now based in France and works from her native country. She worked for two years on the data team of Argentina’s La Nacion. She has also published in Slate and Libération and worked as a correspondent in Buenos Aires for French newspapers Le Figaro and Mediapart.

