The New York Times analyzed 1,150 episodes of Tucker Carlson Tonight to determine how he spreads extremist views and conspiracy theories. Image: Screenshot.
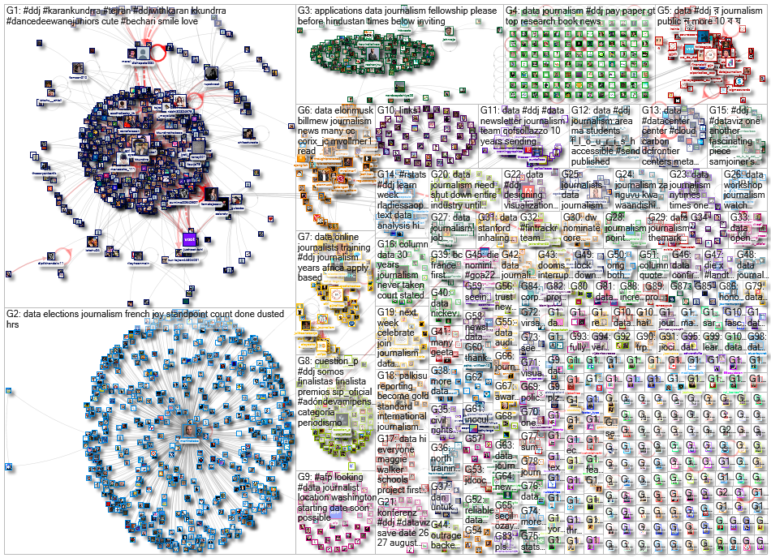
Internet blackouts and digital repression are becoming go-to tactics for authoritarian governments worldwide to silence the voices of their citizens. The news site Rest of World examines these troubling phenomena from a global perspective. Our weekly NodeXL and human curation of the most popular data journalism stories on Twitter also features a brilliant New York Times analysis of talk show host Tucker Carlson’s extremist rhetoric, The Wall Street Journal’s look at Elon Musk’s Twitter usage, Die Zeit’s reconstruction of the battle in Mariupol, Ukraine, and tips to make data visualization more accessible to readers with disabilities.
Global Internet Blackouts
Increasingly, authoritarian governments are turning to a common tactic to stifle dissent: internet blackouts. There are varying levels to this online censorship, including blocking particular websites, technical attacks, social media bans, or total telecom shutdowns. Based on data from a variety of sources — Access Now, Freedom House, Citizen Lab, plus interviews with over 70 people — tech news site Rest of World took a deep dive into the growing problem of government-led internet blackouts.
Internet blackouts are becoming increasingly common. In the past decade, there have been at least 935 total or partial internet shutdowns in more than 60 countries https://t.co/xomHuWAQ46 pic.twitter.com/rqSLEGWAfV
— Rest of World (@restofworld) April 28, 2022
Analyzing Tucker Carlson’s Rhetoric
Tucker Carlson is an American right-wing political talk show host on the Fox News channel who routinely pulls in the highest ratings on cable TV news. As part of an exhaustive, four-part series, The New York Times analyzed 1,150 episodes of the show from 2016 to 2021 to reveal how Carlson spreads extremist ideas and conspiracy theories to more than three million viewers five nights a week. The episodes were downloaded from the Internet Archive’s TV News Archive, and the transcripts pulled from LexisNexis. In more than 800 shows, he pushes the idea that “they” (the ruling class) have a plot against “you” (normal folk) on topics ranging from gun control to COVID-19 restrictions. He also invokes the longstanding racist conspiracy called “replacement theory” (the replacement of native-born Americans with immigrants), blames shifting gender roles for the demise of traditional family structures, and frames equity issues as discrimination against white people. Key points of the Times’ analysis are highlighted in this tweet thread.
Condolences to the reporters who had to watch most of Tucker Carlson's 1,150 shows since 2016 about "us" vs the "ruling class," an enemy now featured on virtually every single show. Nice work by @nytimes for breaking down how this propaganda works: https://t.co/7sWIXATgem pic.twitter.com/8Gv310LF46
— Michael J. Coren (@MJ_Coren) May 2, 2022
Elon Musk’s Twitter Usage
Elon Musk, the richest person in the world according to Bloomberg Billionaires Index, is planning to take over Twitter in a roughly US$44 billion deal. The Wall Street Journal analyzed more than 15,000 tweets posted by the founder of SpaceX and CEO of Tesla, and categorized them by topic, time of day, mentions of Twitter or superfans, and more. Musk’s favorite emoji? The one depicting “rolling on the floor laughing.”
🤣 Only the @WSJ could deliver this deep data reporting.
Behold, @elonmusk’s most common emojis: https://t.co/swkhAxAENl 🤣 pic.twitter.com/WQ8UJDTmTy
— Joanna Stern (@JoannaStern) April 29, 2022
Mapping Conflicts in the Amazon
The Mapa dos Conflitos (Map of Conflicts) is a database project by Agência Pública, a GIJN member investigative nonprofit, and Brazil’s Pastoral Commission, a church-backed initiative. It maps more than 7,000 instances of rural conflict, by municipality, in Brazil’s Legal Amazon region in the last decade (2011-2020). It also categorizes conflicts by whether they were linked to issues such as deforestation, wildfires, mining, water, agrotoxins, violence, or inequality. The database is available in English, Portuguese, and Spanish.
Trabalho espetacular! O Mapa dos Conflitos reúne dados dos últimos dez anos de conflitos na Amazônia Legal, que vão desde questões fundiárias ao garimpo ilegal.
Análise da @agenciapublica com dados da @cptnacional
Bem desenhado, real! https://t.co/Glkr9TqZvi— Haissa Beatriz (@BeatrizHaissa) May 1, 2022
Analyzing Russian Army Deaths
Mediazona and a team of volunteers studied more than 1,700 reports on social networks, in the media, and on government agencies’ websites, to estimate the deaths of Russian soldiers in Ukraine. According to the analysis, most of the deceased soldiers were young people from poor Russian regions. Two republics — Dagestan and Buryatia, where the median salary barely exceeds 20,000 rubles (US$308) — suffered the highest losses.
Putin started a war with Ukraine. The Russian Ministry of Defense hides losses. We found out what is known about the dead Russian soldiers according to open data https://t.co/NBefusKJRL
— Смирнов (@sssmirnov) April 25, 2022
The Siege of Mariupol
Russian forces laid siege to Mariupol, one of Ukraine’s largest cities, at the start of Russia’s invasion of Ukraine on February 24. There have been reports of relentless military bombardments, scarcity of food and water, and internet and telecommunications blackouts. What has really happened in the fierce battle for the city, now raging for more than two months? German newspaper Die Zeit reconstructed events in Mariupol through satellite images, maps, videos and images from social networks, and conversations with those who fled, as well as survivors in the city.
Rarely has the destruction in a war been so well documented as in #mariupol. @zeitonline documents the siege of the city in chat histories, satellite images, maps and videos. https://t.co/Cyju7xFUGb pic.twitter.com/cPglJeNnEA
— Max Boenke (@mx_boenke) April 28, 2022
UK Public Transport Woes
The Financial Times takes a look at the social, environmental, and economic costs of unreliable and confusing bus services outside of the UK capital, London. One particular log scale graph in the piece, which illustrates how the use of buses outside London dropped drastically since the market was deregulated, captured the attention of readers with its nonlinear y-axis. In this tweet thread, data journalist John Burn-Murdoch explains FT’s choice to use the log scale, and how it helps to convey the right context for the story.
Great piece by @JenWilliamsMEN on the disaster of local bus services outside London, & what it costs in terms of jobs, productivity, etc https://t.co/oUvcjGl7A4 pic.twitter.com/qr6iOJaXjS
— Sarah O'Connor (@sarahoconnor_) April 27, 2022
Corporations Buying Up Homes
The News & Observer partnered with The Charlotte Observer to examine home ownership in the US state of North Carolina, and revealed how roughly 20 corporations gobbled up more than 40,000 single-family homes across the state within the last decade. Find the data and stories in the Security for Sale series on Github. Investigative reporter Tyler Dukes summarizes the investigation in this tweet thread.
How do financial institutions become your landlord? Great reporting and graphics by @newsobserver/@theobserver on how across North Carolina, about 20 major investment firms own at least 40,000 single-family homes. https://t.co/VHS3P4CEAR
— Arcelia Martin (@arcelitamartin) May 2, 2022
Replication Crisis
The Pudding found a study that claims a person’s ability to simulate random behavior peaks around 25 years old, and declines after 60. The site’s team tried reproducing this scientific study by setting up their own experiment, consisting of three short tasks related to chance: coin toss, dice roll, and picking a sequence of dots. However, the Pudding’s team disagreed with one important aspect of the original study (the criteria set for filtering of questionable responses) and thus tweaked their data analysis to reflect that. The result: The Pudding concluded that there is no evidence to support a correlation between age and randomness. This disconnect with the original study’s findings, The Pudding explains, speaks to a larger crisis about the ongoing difficulty in replicating scientific studies.
🧪 new experiment! how random are you? come for the quiz to find out, and stay for the discussion about replication and methods 🤓https://t.co/U5Sk0RatCu pic.twitter.com/X1vdIhrE9R
— The Pudding (@puddingviz) April 28, 2022
Accessible Dataviz
French media have been busy producing charts, maps, and data analyses of that country’s recent presidential elections. Many of them utilized a multitude of colors, or shades of colors, to get the information across. A critique of those maps by accessibility and data science researcher Frank Elavsky got some attention on Twitter. He pointed out that the data visualizations he has seen were not accessible for people with disabilities, and proposed five concrete steps newsrooms can take to rectify that.
Unfortunately, I have yet to see even a single map or chart about the election results in France that have alt text.
Many charts fail to have minimum contrast too.
Everyone deserves access to this information! It's a human right, after all.
I'll give 5 tips:
— Frank ⌁ (@FrankElavsky) April 25, 2022
Thanks again to Marc Smith and Harald Meier of Connected Action for gathering the links and graphing them. The Top Ten #ddj list is curated weekly.
 Eunice Au is GIJN’s program manager. Previously, she was a Malaysia correspondent for Singapore’s The Straits Times, and a journalist at the New Straits Times. She has also written for The Sun, Malaysian Today, and Madam Chair.
For a look at NodeXL’s mapping on #ddj and data journalism on Twitter, check out this map.