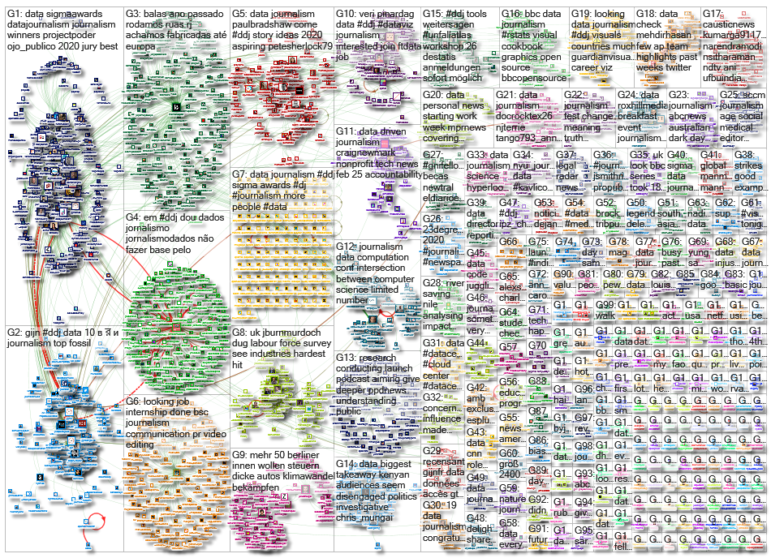
What’s the global data journalism community tweeting about this week? Our NodeXL #ddj mapping from February 17 to 23 finds geographer Tim Wallace collecting some amusingly unusual maps, The Guardian analyzing the effect of Airbnb on home ownership in Great Britain, and former Ogilvy & Mather chief creative officer Tham Khai Meng sharing how a Japanese newspaper utilized augmented reality to animate graphics.
‘Forgotten’ Unusual Maps
Overlapping pie charts, a cylindrical globe, and checkerboard bar charts: just a few examples of amusingly perplexing old maps that will either make you laugh or cringe. A list of 30 of these gems were collected by geographer Tim Wallace in this post and spreadsheet.
For all those times you want to annoy your local Carto-vigilante @wallacetim
Similarly, your friendly neighborhood Carto-vigilante will put you on notice for allowing something as vile as overlapping symbols to appear on a map. Occlusion be gone! 🙅♀️🗺🙅 https://t.co/CBT5YZqY0R
— Rosemary Wardley (@RosemaryWardley) February 19, 2020
Airbnb ‘Out of Control’ in Britain
The prevalence of Airbnb in Britain has prompted concerns that the expansion of short-term rentals on the platform is “out of control” and negatively affecting home ownership of local communities. The Guardian cross-referenced a database of more than 250,000 Airbnb listing with government housing stock figures to calculate the “penetration rate” of Airbnbs across England, Wales, and Scotland.
Wow: "In some parts of Great Britain, there is one Airbnb listing for every four homes https://t.co/L840wMgukA" pic.twitter.com/jNNQIemhFB
— Kris Olds (@GlobalHigherEd) February 20, 2020
Animated Graphics Using Augmented Reality
Here’s something cool, shared by former Ogilvy & Mather chief creative officer Tham Khai Meng: A Japanese newspaper paired augmented reality with its printed paper to display chart animations.
Japanese newspaper uses Augmented Reality to show animated charts. Great fun working on this.
ht @page_ecopic.twitter.com/qJowc0t8Ry
— Khai (@ThamKhaiMeng) February 18, 2020
Analyzing Operation Lava Jato Sentencing
According to an analysis by Brazil’s Agência Pública, it used to take less than a year (more precisely 263 days) to deliver a sentence in federal court criminal cases related to the corruption investigation Operation Lava Jato before the impeachment of the country’s 36th president, Dilma Rousseff. Now the pace of resolving the lawsuits and issuing sentences takes almost twice as long at 448 days. (In Portuguese.)
Levantamento da @agenciapublica: depois do impeachment, o tempo médio do então juiz e atual ministro da Justiça para emitir uma sentença quase dobrou. Questão de prioridades https://t.co/6TdZ6VPMu0
— Glauco Faria (@glaucofr) February 17, 2020
A Look at Doctors in Russia
Proekt Media looks at data on doctors in Russia: How the numbers have changed since 1990; how salaries affect the numbers of doctors; growth in public sector versus private sector; and how doctors’ burden rates affect mortality rates. (In Russian.)
Начинаем год с важного исследования государственной системы здравоохранения: как нагрузка врачей влияет на показатели смертности, и почему все больше медиков уходят в частную медицину.
1/6https://t.co/NQDFE9x1AI— Проект (@wwwproektmedia) January 15, 2020
Democratic Race Advertising Blitz
The Financial Times analyzed ad spending by Democratic candidates during the US presidential primary season. Hard to miss: billionaire Michael Bloomberg’s $400 million TV ad blitz.
NEW with @brookefox91 & @annaknicolaou:
We took a look at how Mike Bloomberg has surged into the race to be Democratic nominee, "donating" himself over $200m to streak past the conventional candidates who took a year to raise less than half that amount https://t.co/sjIwflPczc pic.twitter.com/2jgrFeMJlM
— John Burn-Murdoch (@jburnmurdoch) February 19, 2020
BBC R Graphics Cookbook
In case you missed it, the BBC released a “cookbook” for R graphics last year, to make it easier for other data journalists to create graphics using the programming language. This includes open source code for making line charts, bar charts, histograms, and more.
📝📊 “BBC Visual and Data Journalism cookbook for R graphics” // BBC Open Source @BBCOpenSourcehttps://t.co/Wkm9pvYLf0#rstats pic.twitter.com/9g7kWRkB3W
— R posts you might have missed! (@icymi_r) February 17, 2020
Mapping Systems Using Empathy
Data journalist Paul Bradshaw shares tips on how to tap into one’s empathy to come up with investigative story ideas. The process involves mapping out existing systems, such as housing, transportation, or health systems, and exploring their human impact.
How to map systems to come up with story ideas? Empathy as an investigative tool by @paulbradshaw #ddj #journalism https://t.co/SroZKwOs0M
— Marta Ballada (@mballada) February 20, 2020
Collaborative Database Catalog
Base dos Dados is a collaborative catalog of Brazilian and international databases to assist academics, journalists, developers, and civil society in finding available data. It does not provide data itself, but links to where particular data is located and provides instructions on how to access the data. (In Portuguese.)
200 bases registradas na Base dos Dados até agora. Em várias áreas, desde internet, conflito, até música.
Mas nossa primeira meta é 500 bases. De uma em uma chegamos lá. Quer colaborar? É só entrar em https://t.co/EY72P5xWiu e começar! pic.twitter.com/i7yyNEjCz5
— Base dos Dados (@basedosdados) November 13, 2019
One Year On: Data Viz Society
The Data Visualization Society looks back at the development and growth it made in its first year in terms of membership, organizational infrastructure, published articles, social media following, and more.
We’ve published 217 articles on our online journal, Nightingale (through Medium).
It's allowed us to pay authors, illustrators, & editors 💵$22,200💵
If you are interested in contributing (and getting paid): https://t.co/kKoreSm2LH
— Amy Cesal (@AmyCesal) February 20, 2020
Thanks again to Marc Smith of Connected Action for gathering the links and graphing them. The Top Ten #ddj list is curated weekly.
 Eunice Au is GIJN’s program coordinator. Previously, she was a Malaysia correspondent for Singapore’s The Straits Times, and a journalist at the New Straits Times. She has also written for The Sun, Malaysian Today, and Madam Chair.
For a look at NodeXL’s mapping on #ddj and data journalism on Twitter, check out this map.