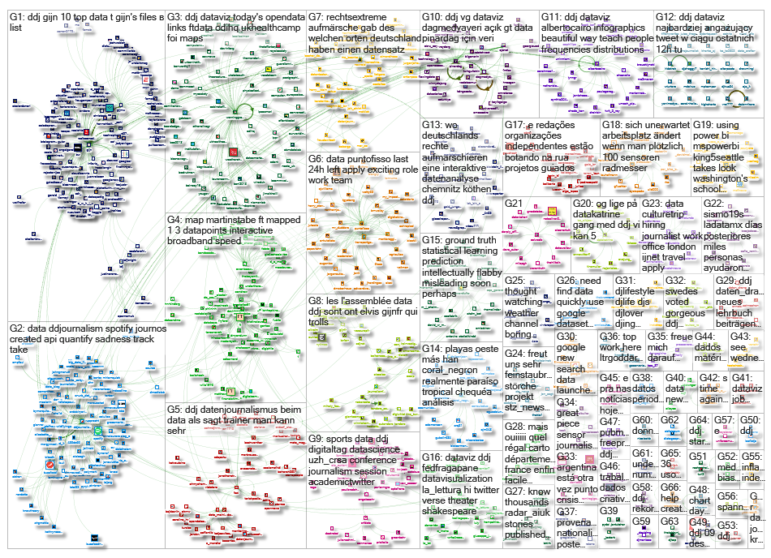
What’s the global data journalism community tweeting about this week? Our NodeXL #ddj mapping from Sept 10 to 16 finds @miriamquick analyzing @Spotify data to rank the top five saddest songs, @Code4Africa creates a tool to measure gender pay gap in African countries, @fedfragapane shares beautiful illustrations on Instagram, #edjnet finds Italy, Turkey and Greece topping the list of Europe’s xenophobic countries, and @TaylorMirf highlights the low rates of immunizations in Washington state.
Saddest Songs on Spotify
Spotify built an algorithm that aims to quantify the amount of sadness in a music track. Data journalists poring over the data have developed interesting stories — a ‘gloom index’ of Radiohead songs, the most depressing Christmas song, and which European countries prefer sad songs. Data journalist Miriam Quick did her own analysis to find the saddest pop songs to top the charts.
Can data reveal the saddest Number 1 song ever? Worth reading just for the "Index of Gloom" of @radiohead songs 😄😄 via @miriamquick @BBC_Culture https://t.co/3FNwnswadi #dataanalysis #datascience #ddj #music #bigdata pic.twitter.com/zefhSU7uKB
— Mathias Golombek (@EXAGolo) September 4, 2018
Gender Pay Gap Tool
GenderGap.AFRICA is a tool designed by Code for Africa to help users calculate the average gender pay gap in any African country. It uses estimated earned income data from the World Economic Forum’s Global Gender Gap Report 2017.
.@ICFJKnight Fellow @justinarenstein presents https://t.co/QmFRD596Gb, an interactive tool by @CodeForAfrica that lets users visualize the gender pay gap across African countries. #StealMyTool #ONA18 #ddj pic.twitter.com/weGVSUBnGY
— ICFJ (@ICFJ) September 13, 2018
Beautiful Visualizations
Award winning information and visual designer Federica Fragapane’s instagram account is a thing of beauty. It is full of her beautiful illustrations and data visualizations.
I'm also on Instagram! https://t.co/Dt8WyrSDVQ With my #dataviz projects, some #illustrations + #infographics combinations and a little bit of #cartography! #Datavisualization #ddj pic.twitter.com/dmNLI0lrBK
— Federica Fragapane (@fedfragapane) September 10, 2018
Community Immunization in Washington
A KING 5 analysis of school-reported data revealed that a majority of schools in Washington are failing to meet the state’s target rates for vaccinations. Nearly half of the 1,425 schools have immunization completion rates that were too low to effectively prevent the spread of whooping cough, and hundreds fell below the herd immunity levels for other diseases, too, like measles and rubella.
.@KING5Seattle takes a look at Washington's school immunization rates using Power BI. Watch: https://t.co/VHClX8oSf2 #dataviz #ddj
— Power BI (@MSPowerBI) September 12, 2018
Mapping 1.3 Million Data Points
David Blood and Ændrew Rininsland describe how Financial Times mapped 1.3 million postcode-level datapoints using Mapbox and overcame several limitations to make an interactive broadband speed map.
Interesting write up on mapping 1.3m data points & #gis tools used to get around @mapbox hosting limits https://t.co/s4OQLR4e4J
— Dan O'Neill (@jdoneill) September 13, 2018
Algorithm Course
Computational journalist Jonathan Stray posted a course on algorithms used in journalism, for beginning Python programmers, on Github. There are seven weeks of material from 13 classes. Dig in!
I've just posted my syllabus and all notebooks and data for the Algorithms in Journalism class I just taught in the LEDE program. Some highlights follow. Maybe you can learn or teach something with this stuff. https://t.co/KuLdHUbpkj
— jonathanstray (@jonathanstray) September 10, 2018
Xenophobia
OBC Transeuropa analyzed the evolution of European nations’ attitude towards foreigners from 2009 to 2015. On average, the most negative opinions on the presence of foreigners were recorded in Italy, Turkey and Greece. (In French)
Right-Wing Rallies in Germany
Berliner Morgenpost’s interactive map shows where right-wing extremists have marched in the streets since July 2013. Most right-wing demonstrations have taken place in Thuringia over the past five years, with a total of 323 demonstrations and 51,662 participants. In contrast, the north of Germany has remained largely immune to such demonstrations. (In German)
Wo Deutschlands Rechte aufmarschieren: Sehr schöne Datenjournalismus wieder von @funkeinteraktiv https://t.co/G0aNcorC2O pic.twitter.com/4bNQftNqzS
— Jörgen Camrath (@uniwave) September 11, 2018
Elvis Visualization Tool
Elvis is a tool to help journalists visualize raw and dirty public spending data. You can also explore relationships between government and companies. It is still in beta so they welcome feedback.
In Elvis, missing #data becomes fruit. How much of your taxes have turned into 🍉🍓🍇 ? See at https://t.co/HF0RNVeC79 #PublicSpendingIsFUN #opencontracting #ddj #fightcorruption w @EUTenders @digiwhist pic.twitter.com/bmvis9KhkA
— Elvis (@tenders_exposed) September 14, 2018
Turkish Open Science Summit
The Turkish Open Science Summit was broadcast live on the Sabanci University Facebook site. Speakers included Ilkay Holt, Prof. Dr. Şebnem Burnaz, Prof. Dr. Şirin Tekinay, Oguzhan Öztürk and İsmail Gülle. (In Turkish)
Türkiye Açık Bilim Zirvesi çok değerli panelistlerin katılımıyla son oturumda “Açık Bilim ve İnovasyonu” tartışacak. Paneli canlı yayında takip edebilir sorularınızı Facebook üzerinden gönderebilirsiniz. https://t.co/NRzoAkO2XZ #AçıkBilim #OpenScience
— Açık Erişim Türkiye (@openaccess_tr) September 10, 2018
Thanks, once again, to Marc Smith of Connected Action for gathering the links and graphing them.
 Eunice Au is GIJN’s program coordinator. Previously, she was a Malaysia correspondent for Singapore’s The Straits Times, and a journalist at the New Straits Times. She has also written for The Sun, Malaysian Today and Madam Chair.

