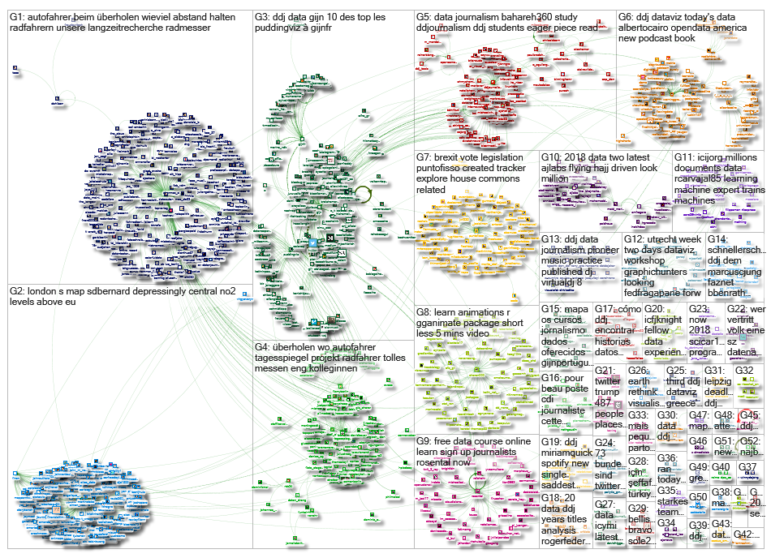
What’s the global data journalism community tweeting about this week? Our NodeXL #ddj mapping from Aug 20 to 26 finds @Numerama analyzing the representation of women in @netflix series and finds it lacking, @AJEnglish creating an interactive explainer on how two million Muslims make the pilgrimage to Mecca every year, @FT readers brainstorming air pollution solutions for London, and @Bastamag digging into the data of @Airbnb — a cash cow for home renters.
Netflix, House of Men
Netflix is today one of the most important players in the world of entertainment, and the company is proud of its diversity. But Numerama analyzed the proportion of women among the actors, directors and writers of 115 original Netflix series and their 1,912 episodes, and found representation of female actors, directors and writers somewhat lacking. (In French.)
#dataviz "Les femmes dans les séries : Netflix, une House of Men", une belle enquête de @marine_vdk avec @we_do_data pour @Numerama : quelle place la plateforme de streaming réserve-t-elle aux femmes dans ses séries originales ? https://t.co/0BAsFODi5d pic.twitter.com/la9uc289tk
— WeDoData (@we_do_data) August 20, 2018
Pilgrimage to Mecca
Al Jazeera created an interactive explainer on how two million Muslims from around the world travel to Mecca for Hajj every year.
This is what a plane would look like if it was filled with all the Hajj pilgrims last year https://t.co/QoaJlCLscp #Hajj2018 pic.twitter.com/lpNlOH9sTs
— Al Jazeera English (@AJEnglish) August 23, 2018
Airbnb Cash Cow
The arrival of Airbnb in major European cities has pushed up housing and rental prices at the expense of people who live and work locally. France is no exception. Data published by Inside Airbnb shows that in 2016, 55,720 homes and rooms were rented out via the platform. And 20 percent of the owners (more than 9,300 people) had several dwellings on offer. (In French.)
Ces multi-propriétaires qui engrangent des centaines de milliers d’euros grâce à Airbnb https://t.co/HaGFkZk2dJ via @Bastamag @InsideAirbnb #logement #locations #data #ddj pic.twitter.com/bVvna5vvxT
— GIJN en français (@gijnFr) August 24, 2018
London’s Air Pollution
London is suffering from high levels of nitrogen dioxide air pollution — comparable to Delhi and Beijing — which inflames people’s lungs and is linked to shorter life expectancy. Here are crowdsourced solutions to the city’s foul air.
A community editor's dream: hundreds of @FinancialTimes readers are brainstorming solutions to London's air pollution problem with the great @lesliehook below her recent story https://t.co/MUMYdMFYbT pic.twitter.com/BKFud6RwV9
— Lilah Raptopoulos (@lilahrap) August 21, 2018
Cycling Hazards
Tagesspiegel is running an ambitious project to research cycling in Berlin, including its routes and hazards. They issued a call for Berliners to help collect data using proximity sensors to measure distances between cyclists and motorists. (In German.)
How close do cars really get when overtaking cyclists? Which streets are most dangerous? Exciting project in Berlin is collecting accurate data. https://t.co/gdEHRb8T2M
— Thies Lindenthal (@ThiesLindenthal) August 22, 2018
ICIJ Employs Machine Learning
The rise of the machine has freed ICIJ members to pore over millions of documents in a custom-built search engine. Rigoberto Carvajal describes how the consortium streamlined the process of wrangling big data and efficiently filtering it.
I get excited by what tech can do, esp when people talk about the how it works and not just shiny marketing. Thanks to the folks at the BEST legal data tech team out there https://t.co/EaqXOTsSVk
— alexgsmith (@alexgsmith) August 25, 2018
Custom-Made Charts
Charticulator, a project from Microsoft Research, is an interactive authoring tool that enables the creation of custom-made and reusable chart layouts, all without requiring any coding. Open source at Github.
⚡️Announcing #Charticulator: a new interactive tool for bespoke #visualization design from @MSFTResearch
Try it in your browser at https://t.co/cHnX0pD4pF, where you'll also find a gallery along with video tutorials.
Charticulator is #OpenSource at https://t.co/loPVqvf8ZE pic.twitter.com/E425FzGyiw
— Bongshin Lee (@bongshin) August 15, 2018
Data Journalism Tips
Data journalist Juan José Lyon shares some key ideas and tips to work with files and transform data into stories. From a workshop organized by the Chilean Journalists Network. (In Spanish.)
Cómo encontrar historias en los datos https://t.co/ORw503KvyN #periodismodedatos #ddj
— Gerardo Albarrán de Alba (@saladeprensa) August 19, 2018
Subsidizing Transport in Pakistan
Media for Democracy takes a look at the subsidies for a metrobus service in Islamabad, which runs into billions of rupees.
Investigation by @mmfd_Pak about how the ever growing subsidy for Rawalpindi Islamabad Metrobus can't keep up with the ballooning deficit #ddj #datajournalism https://t.co/DB3luJw8TO
— Eva Constantaras (@EvaConstantaras) August 21, 2018
Reading Web Archival Content
This WARC (and ARC) Streaming Library provides a fast, standalone way to read and write WARC Format commonly used in web archives.
Thanks to the free #Python library https://t.co/OscQKDTy3Q the new #opensource beta release of #Open Semantic #Search can extract, analyze and index archived websites in #WARC web-#archive file format, too. #ddj #openglam #textmining #Solr #elasticsearch
— Open Semantic Search (@OpenSemSearch) August 24, 2018
Thanks, once again, to Marc Smith of Connected Action for gathering the links and graphing them.
 Eunice Au is GIJN’s program coordinator. Previously, she was a Malaysia correspondent for Singapore’s The Straits Times, and a journalist at the New Straits Times. She has also written for The Sun, Malaysian Today and Madam Chair.

