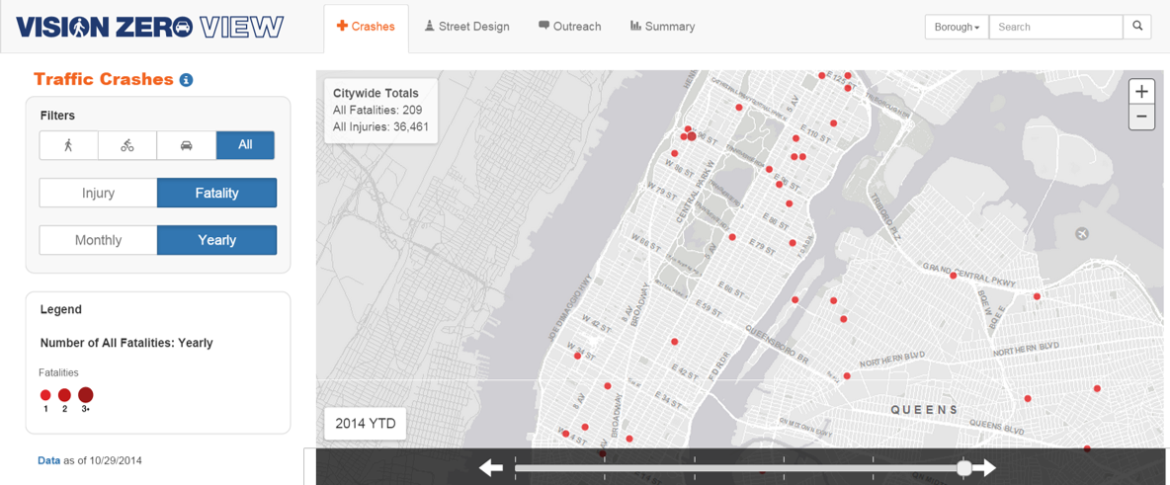
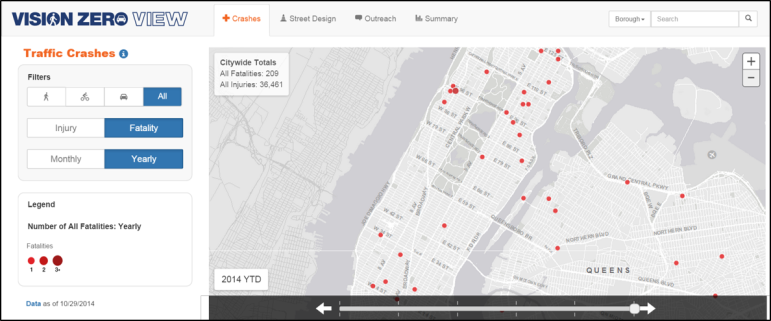
Last month, New York City put up a site called Vision Zero View, which contains maps and data that depict the location of bicycle and car injuries and fatalities in the five boroughs of the city from 2009 to 2014. Amazingly, this site tells us that vehicular accidents occur on streets, with subtle variation in severity and frequency over five years!
Maps like these do help citizens to relate nightly news stories of traffic accidents to trends across the city. And seeing the events over the scale of five years is helpful. I commend the City for making this available. But it isn’t enough. We need more data than this to understand how these incidents occur, why, and how they effect New Yorkers.
Here is what I want instead. I want the city to publish this data as open data in an online toolkit in which each traffic incident is a URI (Universal Resource Indicator) which contains linked data records with anonymized information about the incident and allows people to augment the city’s records with information from their own experiences. The driver, a passenger, bystanders, policemen, or victim(s) should be able to tell their stories about what happened to them in each incident in prose, photos, video, news accounts, and public record. Accidents are significant events in people’s lives and the city can transform dots and maps into a rich dialog.
Data geeks should be able to add new data layers to the maps, providing more rich contextual information about the weather, time of day, visibility, commercial congestion, flow of traffic, alternate side of the street parking, speeding violations, and photos of the streets on the days of the accidents.
Developers should be able to add dynamic simulations to change the variables and test policy against the past, present, and future of accidents on real streets using historical and forecasted data.
Economists should be able to study the impact of traffic incidents on aggregate productivity, health costs, insurance claims, auto financing, and urban GDP. Social scientists should be able to trace the path of each accident to levels of PTSD (post-traumatic stress disorder) and monitor chain reactions in urban trauma and violence. Healthcare workers should be able to study the patient supply chain from accidents to ambulatory services, emergency room wait times, and treatment outcomes — to prioritize services at different times of the year and day.
And journalists should be able to corroborate sources, fact check private media, and piece together stories from the data that provide narrative description of how seemingly random rivulets of chance errors and omissions stream together to create a CRASH of metal and flesh that transmogrifies lives forever.
Telling us that traffic accidents happen on streets over time is nice, but it’s just the beginning of an Open Data Odyssey that governments, civil society, and other organizations must begin together to document and describe the tertiary impacts of these events, and many other events, on our collective experiences and lives in large urban ecosystems like New York.
I hear vendors tell customers all the time that we are drowning in too much data.
No.
We are walking in the shallows and the data is barely covering our toes. We don’t understand the world we live in, why things happen, and how policies shape what we want.
We need MUCH more data.

Steven Adler (@DataGov) is chief information strategist for IBM. He is an expert in data science and an innovator who has developed billion-dollar-revenue businesses in the areas of data governance, enterprise privacy architectures, and Internet insurance. He has advised governments and large NGOs on open government data, data standards, privacy, regulation, and systemic risk.


